<TradeVSA> SUPERMAX Pullback Completed?Sign of Strength in the chart:
1. Reversal with increasing Volume
2. Pullback in hourly chart
3. Green Pentagon high volume
Disclaimer
This information only serves as reference information and does not constitute a buy or sell call. Conduct your own research and assessment before deciding to buy or sell any stock
SUPERMX trade ideas

SUPERMX - Down Trend to Up Trend LineTrend line broken and become uptrend for now.
Higher high & higher low formation at the moment.


BULLISH FLAGThis counter seems like retracing and this can be opportunity to re-entry at the best possible price. We have seen clearly strong buying momentum and selling momentum slowing down as there's no LL created recently. Perhaps, price reject near support trendline and moves with slow downside momentum. Only consider to entry if price could hold the support area. My risk for the entry just below the recent low.

SupermxFirst B signal on7th April and 1st chocolate ball turn down as a support at price 3.76 before the following day shoot up.
On 8th April the price was shooting up then the following days, price retracement but chocolate ball move upward and well support with low volume. A good buying signal appeared.
Today B signal appeared, and the price was shooting up 10%.


SUPERMX 7106 MYX 1 Hour Momentum BreakoutStudy...based upon Volume Price Spread Analysis and Momentum
SUPERMX has shown breakout in Momentum in 1 Hour Timeframe
Close: 4.35
EP: 4.26 - 4.43
SL: 4.06/3.82
TP: 5.17/5.55/5.93
Disclaimer: This study does not constitutes Buy/Sell per say. Please consult your financial advisor before making any trading/investing decision

Supermx - up momentum resumeSupermx - up momentum resume
Note: For Interested to subscribe the VT MCDX Smart Money Plus and learn Victor Trade System, and kindly contact owner
(Disclaimer: for demonstrate own planned trade records study only and education purpose, not for recommend to buy or sell. Trade at your own risk

SUPERMX - Potential Double BottomSUPERMX
Theme: Glove
Rst: 4.50/ 5.40
Spp: 4.00
Likely to expect further technical rebound if the stock manages to sustain at 4.50 area as RSI is recovering now, but friendly reminder again, trend is highly bearish now, strong trend reversal will not happen now. Any further rebound, will only last until 5.40 area.

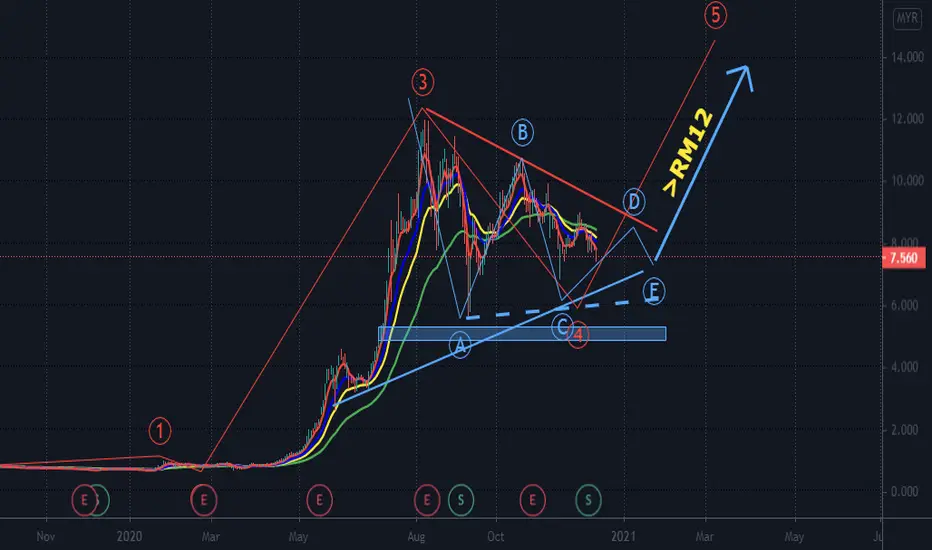
SUPERMX - Selldown Pressure Over, Time to rev up to the MAXEntry Strategy:
1) Entry inside the purple line range - Highly potential reversal trend zone.
2) CL1 and CL2 below the purple line.
Chart:
1) 2020 - Glittering news for glove stock due to unprecedented demand. During this time people risk in on forecast profit growth anticipated.
2) As per expected, whatever boom up need to boom down also - nature of life (kadang2 kita di bawah kadang2 kita diatas)
3) For QR result announcement - people that risk in before will usually sell on news
4) Below EMA line - showing bearish trend start to power the play
I am nubis, i am non-premium members ..follow if you think this idea make sense..just sit back, relax and make some money.
-Heil_Z-
# Are-snuff Traders Club
# Bilis Traders Group

Supermx - Immediate Support ZoneSupermx - Immediate Support Zone (RM3.50-RM3.30), based on Volume Analysis
Note: For Interested to subscribe the VT MCDX Smart Money Plus and learn Victor Trade System, and kindly contact owner
(Disclaimer: for demonstrate own planned trade records study only and education purpose, not for recommend to buy or sell. Trade at your own risk

Immediate support for all glovesGreen line = downtrend X line, supporting line
price fall exactly around the X line and Fibonacci line, showing that here is one strong supporting zone.
Buy for a rebound play, expecting rebound to RM5.2 ~ RM5.6.
Consider a minimal risk to enter at this price.
Cutloss = -10%

Supermax 27.2.2021MYX:SUPERMX
Haven't shown any sign of re-rebound. Wait for further assessment at RM4.5 level, if any.


Supermax Break Resistance, Sign of Trend Reversal!Personally, what I learnt is there must be a Technical Analysis Strategic Plan in order to increase the risk-to-ratios favourable risks.
1. Draw Support & Resistance
2. Identify the stages (Accumulation, Advancing, Distribution, Declining)
3. Entry Triggers
4. Stop Loss
5. Exits
I have learnt during my past mistakes that we should let the stock price comes to us, rather than us chasing the stock prices!

SUPERMX - Support Tested at Fibo Ext 61.8%SUPERMX
Rst: MA50
Spp: 6.85
Second candle affirmed its foothold above Fibo Extension 61.8%, meaning the technical rebound still consist of strength to continue, shall see a break above the descending trendline (refer to chart) before it starts to soften.
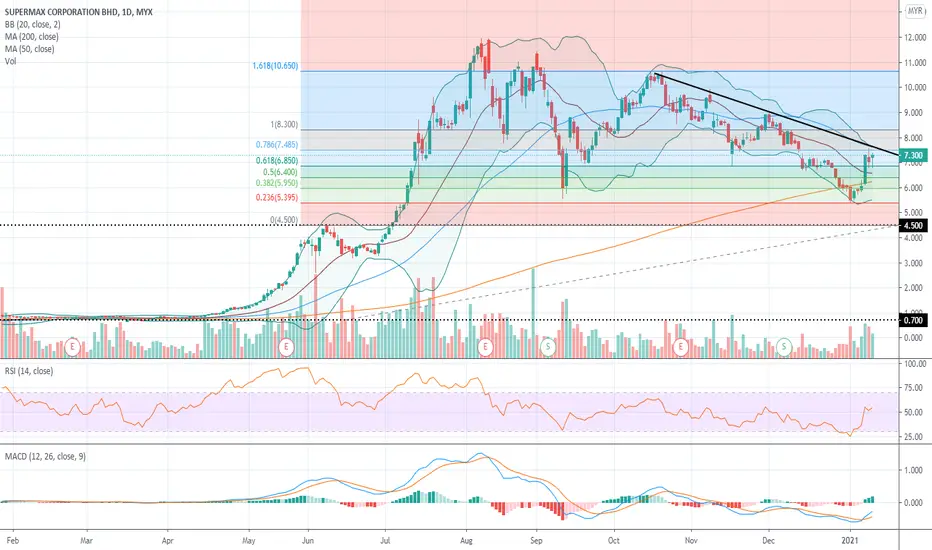
Has Supermax bottomed? Or are we seeing HOPE yet?Can we start to hope for further upside in Supermax? I would answer yes if Supermax can find strong support at RM 6.70 and start to break and close above RM 7.50.
I think the right question to ask right now is has Supermax bottomed? From chart perspective wise, I believe Supermax has not bottomed yet and we could likely see further downside pressure if it breaks and closes below RM 6.60. RM 6.60 is a very crucial level now that the bulls must protect. A failure at this level, could see Supermax retest RM 5.80 level again which is also current daily 200 moving average. Therefore short term wise, I am not bullish on Supermax until it breaks and closes above RM 7.50 again.
Further to this, if bulls fail to also protect RM 5.80 level if it is being retested, it could send Supermax downward some more to around RM 4 range as this range is also the 62% to 78% Fibonacci Retracement level according to the march dip and august peak. Therefore now bulls must strongly protect RM 6.70 level and pushes it up further above RM 7.50 or else bears will have control at this territory.
To support further on the argument of Supermax has not reached its bottom yet, we can study it from the Elliot's wave theory of corrective move ABC. ABC talks above the trend reversal. Early to mid of this year we saw a strong uptrend momentum on Supermax. However in August we started to see a trend reversal for Supermax. This trend reversal can be read as ABC. A wave in this scenario will trend down which took place on 7th Aug in sending down its price from RM11.95 to RM5.55, creating a downward pressure RM 6.40. Then B wave took place in driving up the price to RM 10.65 on 20th October. So how far the next C wave can send Supermax down? The answer is gotten by substracting RM 6.40 from RM 10.65 which will give us RM 4.25. With this, we can believe a further downside pressure could send Supermax down to RM4.25.
In all circumstances, there is always hope, lets hope Supermax to quickly breaks and closes above RM 7.50! Cheers and bye for now! Merry X'mas to everyone! God bless!


SUPERMX 14122020open gapped down break below 7.50 and 7.00
next support zone at 6.00-6.50
wait for bullish price action.


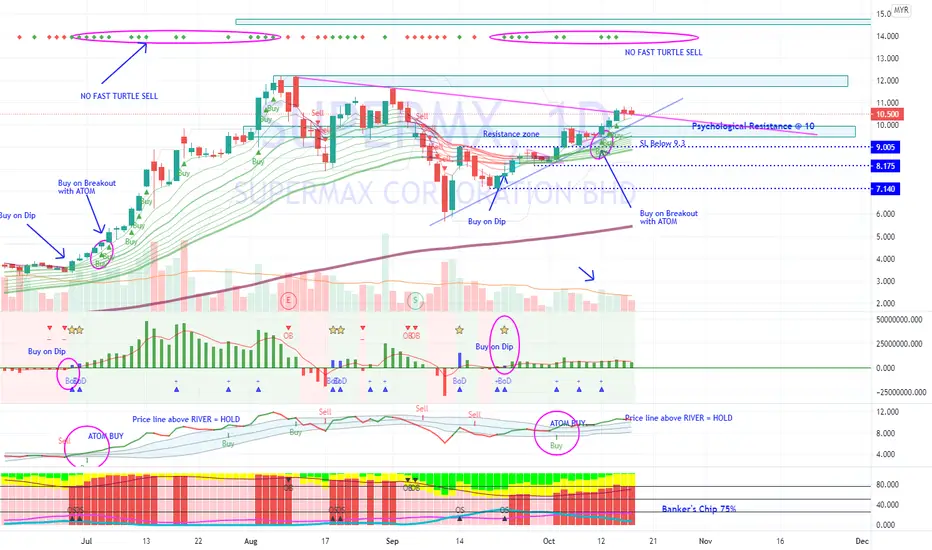
Supermx continue to holdBoD signal on 23 Sep, BoB on 2 Oct. There are no Fast Turtle Sell since then.
Staying above psychological level 10 is a very strong statement from Mr BULL.
FiFT is +ve, Banker's chip >75%.
Price is moving above EMA20 and above ATOM river which mean Bull is running on highway.
Every small pullback is with small volume. This is a very healthy bull.
The rally is mimicking beginning of July rally.
Currently there's no sell signal. Fast Turtle Sell will appear if price close below 10.2. I believe supermx is able to break above 11 (based on current momentum and strong sector)..
Next is 11.5 and 12.