SYSTECH - ideas update- This counter having a long term of bearish condition. It should going for reversal sooner
SYSTECH trade ideas

Systech - sign of reversalBased on Ichimoku cloud and momentum indicator, Systech showing a reversal sign. Systech currently at support area.
Possibility of price reversal is high and we might have new reversal price today.
SYSTECH - idea updateNote.
- Base on Trendband chart, it shows the price slightly decrease during last close. Look for best entry & exit.
-Suggestion, intraday buyer - do additional buy-in within "Intraday" zone when price in correction mode.
- If price keep downtrend until below Divider, looks for other opportunities to do swing for 2 weekly or 3 days onward.
- During correctional phase, it is advisable to add more buy-in volume as it is to stabilize our last purchase .
- Suggest exit or SL if price retrace below Support level

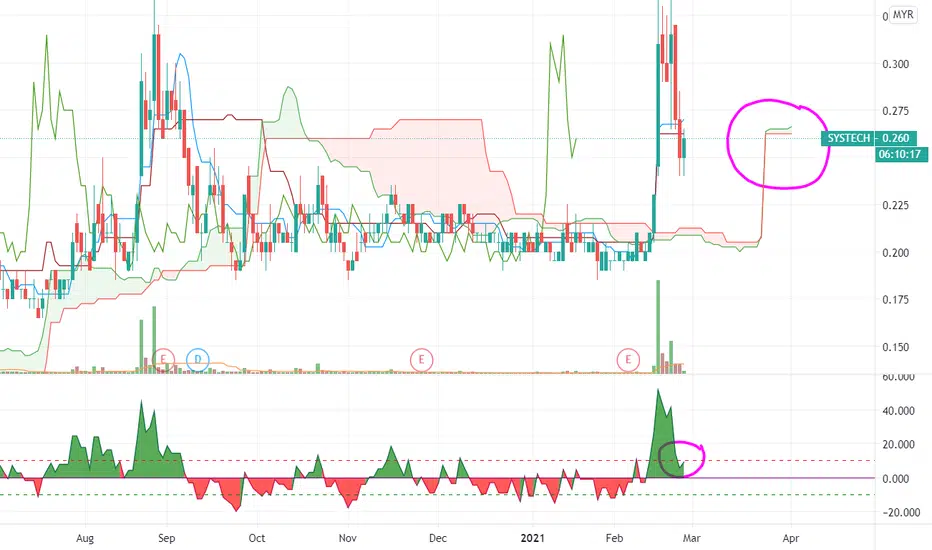
SYSTECH: Breaking 52WH soon?Systech shows a good uptrend move since reversal. Volume is accumulating showing that there is a sign of momentum to break 0.250. Next few TPs if its manage to break 0.25 is 0.270 and 0.30

SYSTECH : Will it able to breakout?These few months SYSTECH has been sideways between 0.185 - 0.235.
Volume starts to kicks in. Can monitor if it is able to break 0.245.
Target price 0.35
Note Just a trading idea. NOT a buy call

Systech breakout from the accumulation Price had been staying there for 5 months,
Price action breaking up high with strong volume.
Targeting +30% profit from current 0.225
Risk Reward ratio: 3++
Cutloss : -9%
Like my works? Please hit the Like, Follow and Share or tip me a few coins :)
Thanks!
Disclaimer
This information only serves as study references, does not constitute a buy or sell call.


SYSTECH [S] 19/9/20 : kembali ke support1. SYSTECH membuat kenaikan harga dengan volume yang besar
2. Gagal meneruskan momentum
3. kembali ke paras support (yang sebelumnya merupakan resistant/RBS)
4. Kesuluruhan masih uptrend
Harga yang sesuai untuk entry?
Disclaimer: Hanya kajian buat pembelajaran. Sila like dan share
"Right place, right vision, right action"

Systech - Major Retracement subwave retracement ABC ..
100% - 161%
akan rebound semula ke major wave 4 to 5

SystechWill it rebound from 1.95 for sub wave 3?
It will be hard to do that with current market.. will see tmrw.

SYSTECH target LONGIt is look like compression at D1 TF toward demand area. Wait for reversal candle form before enter market.

Systech - showing bullish signal after 3 yearsThe great thing about small cap stock is sometimes and most of the time they don't give a fuck about global market and they always move on their own.
This is one example, on the day where most stocks goes down, it goes up. So, why is the stock goes up on this day? Maybe because its bear market is already over.
That's how smart money or whales operate. They pretend that people don't know or can't identify them, but I know and I can identify them.
Sorry whales, I am always monitoring what you are doing, you can't hide you footsteps from me. And I am always there whenever you are. You never know when I will take the position in any stock and I have the bullet and ammo.
Back to the topic, the stock is showing some "strength" since 2017, so this may indicate a reversal and also maybe the end of its bear market.
Plus, Nasdaq is doing hot, tech stocks are generally doing hot. So, it may be time for this stock to pump and go higher.
I don't like to talk about small cap and penny stocks because I know the whales might be reading this. So, this is a lesson on how to detect a whale and understand the whale game play.
Regards.
P/S: I don't read messages and comments.

Long in SYSTECHfrom the chart we can see the price already complete the form Cup and Handle and with broke the resistant line with high volume.
This is suggesting that buyer in position to push the price more higher. With EMA 9 and EMA 20 is trying to cross EMA 200, we can assure that the price will change to long soon.
In low TF, 1H, all EMA already cross EMA 200.
The price now hold at resistant 0.200.
To enter now already late as the no good spot to enter. Wait till the price broke resistant and buy.
TP: 0.235
CL: 0.165
#need your comment and suggestion as all idea for trading is different with other people :)


SYSTECH BERHAD – yang popular dulu kini kembaliAs salam dan salam sejahtera traders semua
SYSTECH BERHAD, antara kaunter favorite saya yang telah menghasilkan keuntungan yang banyak untuk saya suatu ketika dahulu.
Tengok blk trendnya ketika tahun 2016 dan 2017 dahulu. Memang syok trade kaunter ini dahulu
Setelah melalui tempoh correction yang sangat besar bermula NOV 2017 hingga ke JULY yang lepas kini ia bernyawa semula!!!. Whats go up, must come down. INI NORMAL. Dia dah jatuh kan? Supported kan? Now its time go up again
CONFIRM KE AKAN NAIK?
Lihat ketika ia break long downtrend line pada pertengahan JULY yang lalu, perhatikan volume. Nampak x apa yang saya nampak?
YES NEW FRESH VOLUME OF BUYERS COMES IN – apa yang dia beritahu kita?
Buyers are taking control of the market. BUYERS = DEMAND
Nak lebih detail, go to tf30 chart, akan nampak lebih detail MACD keep on staying on positive region. THIS IS GOOD NEWS
Perhati pula MACD DAILY, ia kembali ke positive region dan kekal di sana
WHAT TO EXPECT?
Perhatikan 5 candlestick daily sebelum ini, byk shadow on the upper of the body kan? Ini menunjukkan rejection.
REJECTION bermakna adanya seller yang keep on selling to keep the price lower. Kerja jerung lah ni to say simply. So to be expected harga akan retrace dahulu around 0.305 area before sambung kenaikan.
Tapi kalau momentum masuk, meaning harga break that sellers rejection barrier, just tunggu next higher low. X payah kelam kabut nak kejar, akan ada entry nanti
Supaya anda tidak terlepas mana mana posting terbaru dari saya, sila like/follow saya untuk sebarang idea baru
DISCLAIMER – INI BUKANLAH BUY CALL TETAPI HANYA JOURNAL TRADING SAYA SENDIRI YANG MUNGKIN DAPAt MENJADI PANDUAN KEPADA TRADERS DI LUAR SANA
Halim Hamdan

Systech : Triangle Breakout ?Triangle Pattern breakout at upper side ...
EMA 20 Pointing up Uptrend movement ...
Trading Setup :
Entry : 0.27 ~ 0.275
SL : 0.25
TP : 0.33

SHORT/MEDIUM TERM TRADE - SYSTECH - POTENTIAL BREAKOUTSYSTECH is a profitable company, heading to Resistance zone with stepper uptrendline, signalling potential reversal might be developing.
If price manage too break resistance zone, price might be heading to R1 and R2 if the momentum continues.
Cut losses short if price went below S1.
