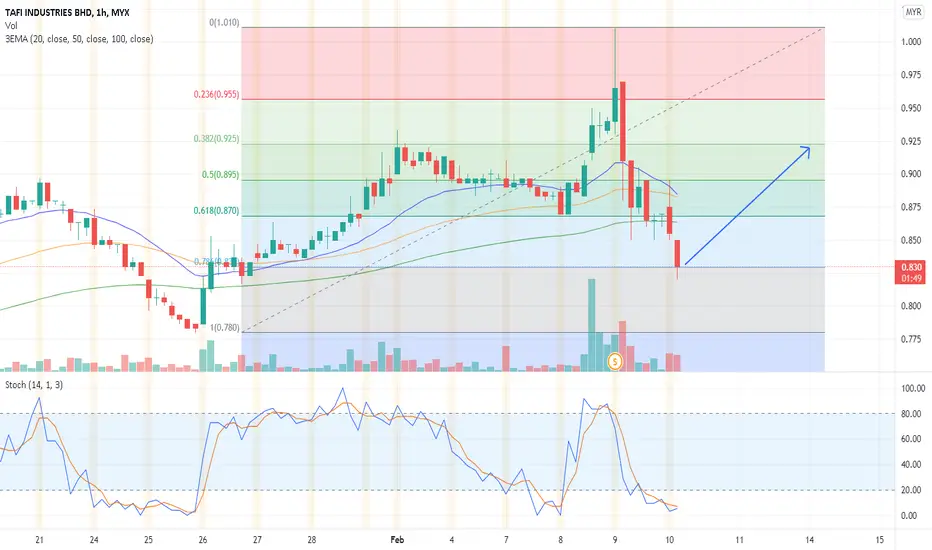
7211 Tafi up up up mirage yellow againRobot shows the potential bottom since June and there were 3 short term uptrend wave after that.
Recently the strong signal shows the wave starting again, stop loss point is approximate 0.59. The short term resistance level is about 0.75.
There is no selling signal from robot mirage red/green cand
0.045 MYR
16.67 M MYR
114.92 M MYR
140.54 M
About TAFI INDUSTRIES BHD
Sector
Industry
CEO
Sze Chien Wong
Website
Headquarters
Muar
Founded
2004
ISIN
MYL7211OO005
FIGI
BBG000QJKZT8
TAFI Industries Bhd. is an investment holding company, which engages in the manufacturing, exporting, and trading of furniture products for the local and overseas markets, construction, and property development. It operates through the following segments: Furniture Products, Construction, and Property Development. The Furniture Products segment focuses on the manufacturing, exporting, and trading of furniture products. The Construction segment refers to the construction activities. The Property Development segment is involved in the property development activities. The company was founded on January 29, 2004 and is headquartered in Muar, Malaysia.
Related stocks

TAFIEP 0.485/0.49/0.495/0.51/0.52/0.525
TP 0.56
SL 0.46
Backtest result from 2022-08-02 10:00:00
32 trades
72% win rate
p.s: not a financial advice
#deepagiscreener #TAYOR #bursa

TAFI - Trendline breakoutPrice has broken the trendline on 20/07/2022 and formed pullback around the trendline area.
Would this indicates for MYX:TAFI to change direction to uptrend?
Potential entry:
RM0.38 - RM0.41
Resistance:
RM0.505 / RM0.54
Support:
RM0.375
Disclaimer: This trading idea is for education purpose on

TAFI rebounding from fibo786 in weeklyCan try to take a long position on TAFI as it appears to be have rebounded from 52-week low and a retest at fibo786. Potential EP retracement will be at 0400, CL below fibo786 and TP at fibo618 as per proposed trade plan.

TAFI 7422TAFI
just analysis for study porpose
how the price react
very nice pattern
markup--distribute-- sideway --markup--distribute
sideway almost 2 week.
better wait for the price create HH and HL ( making setup based)
then find ur entry


TAFI- 4.4.2022Just sharing how to read naked chart.
price movement and price action.
indentify SNR
setup trading plan.
manage ur risk
then press BUY.

LOW CHEAT SETUP TAFIFundamental overall is losing company.But since last year,it showing some improvement of sales and profit.Technically just breakout horizontal resistant line of low cheat setup,but the volume is not convincing.
<TradeVSA> Solid Support with No Supply - KMLOONG | TAFISign of Strength in the chart:
1. No Supply Signal near 20ma
2. Right market stages in uptrend
Disclaimer
This information only serves as reference information and does not constitute a buy or sell call. Conduct your own research and assessment before deciding to buy or sell any stock

See all ideas
Summarizing what the indicators are suggesting.
Oscillators
Neutral
SellBuy
Strong sellStrong buy
Strong sellSellNeutralBuyStrong buy
Oscillators
Neutral
SellBuy
Strong sellStrong buy
Strong sellSellNeutralBuyStrong buy
Summary
Neutral
SellBuy
Strong sellStrong buy
Strong sellSellNeutralBuyStrong buy
Summary
Neutral
SellBuy
Strong sellStrong buy
Strong sellSellNeutralBuyStrong buy
Summary
Neutral
SellBuy
Strong sellStrong buy
Strong sellSellNeutralBuyStrong buy
Moving Averages
Neutral
SellBuy
Strong sellStrong buy
Strong sellSellNeutralBuyStrong buy
Moving Averages
Neutral
SellBuy
Strong sellStrong buy
Strong sellSellNeutralBuyStrong buy
Displays a symbol's price movements over previous years to identify recurring trends.
Frequently Asked Questions
The current price of TAFI is 0.535 MYR — it has increased by 2.88% in the past 24 hours. Watch TAFI INDUSTRIES BHD stock price performance more closely on the chart.
Depending on the exchange, the stock ticker may vary. For instance, on MYX exchange TAFI INDUSTRIES BHD stocks are traded under the ticker TAFI.
TAFI stock has risen by 2.88% compared to the previous week, the month change is a −1.83% fall, over the last year TAFI INDUSTRIES BHD has showed a −15.75% decrease.
TAFI reached its all-time high on Nov 15, 2021 with the price of 1.495 MYR, and its all-time low was 0.055 MYR and was reached on Jun 3, 2020. View more price dynamics on TAFI chart.
See other stocks reaching their highest and lowest prices.
See other stocks reaching their highest and lowest prices.
TAFI stock is 0.00% volatile and has beta coefficient of 0.61. Track TAFI INDUSTRIES BHD stock price on the chart and check out the list of the most volatile stocks — is TAFI INDUSTRIES BHD there?
Today TAFI INDUSTRIES BHD has the market capitalization of 202.99 M, it has decreased by −1.85% over the last week.
Yes, you can track TAFI INDUSTRIES BHD financials in yearly and quarterly reports right on TradingView.
TAFI net income for the last quarter is 1.29 M MYR, while the quarter before that showed 9.84 M MYR of net income which accounts for −86.89% change. Track more TAFI INDUSTRIES BHD financial stats to get the full picture.
No, TAFI doesn't pay any dividends to its shareholders. But don't worry, we've prepared a list of high-dividend stocks for you.
EBITDA measures a company's operating performance, its growth signifies an improvement in the efficiency of a company. TAFI INDUSTRIES BHD EBITDA is 25.11 M MYR, and current EBITDA margin is 19.85%. See more stats in TAFI INDUSTRIES BHD financial statements.
Like other stocks, TAFI shares are traded on stock exchanges, e.g. Nasdaq, Nyse, Euronext, and the easiest way to buy them is through an online stock broker. To do this, you need to open an account and follow a broker's procedures, then start trading. You can trade TAFI INDUSTRIES BHD stock right from TradingView charts — choose your broker and connect to your account.
Investing in stocks requires a comprehensive research: you should carefully study all the available data, e.g. company's financials, related news, and its technical analysis. So TAFI INDUSTRIES BHD technincal analysis shows the buy rating today, and its 1 week rating is buy. Since market conditions are prone to changes, it's worth looking a bit further into the future — according to the 1 month rating TAFI INDUSTRIES BHD stock shows the neutral signal. See more of TAFI INDUSTRIES BHD technicals for a more comprehensive analysis.
If you're still not sure, try looking for inspiration in our curated watchlists.
If you're still not sure, try looking for inspiration in our curated watchlists.