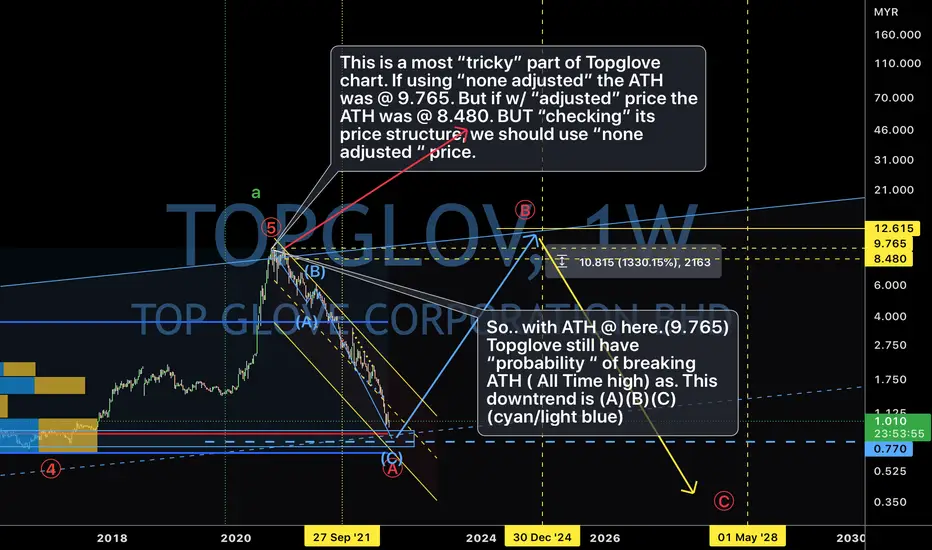
Topglov. >25% majority can’t decide ASP?! 22/Sept/22Topglove. We’re at the “junction/ intersection “ of 2 median line ( dotted yellow) of 2 major (long term) ascending parallel line ( cyan) + Plus Fibonacci 0.386 lvl which is around RM0.570. Let see whether price could keep above RM0.50 for coming few months. We have 2 “news”. The “Good news” is we might close to complete correction of expanding flat (A)(B)(C). But the “ Bad news” is we might just completed wave (a) of the coming multi years triangle / sideway pattern..
TOPGLOV trade ideas
Topglove. Catching falling knife ( downtrend) w/ glove. 15/09/22Topglove. Are you interested to know how to catch a “falling knife” with gloves? Or Topglove more specifically?..Let do some “microsurgery” first with “Topglove” “zooming” into this “ Zone C yellow” to see where it’s centre of cancer location and before cutting its “cancer tumors” with while you might be “hurt” “many times” by catching “falling knife / downtrend “ in surgery room.

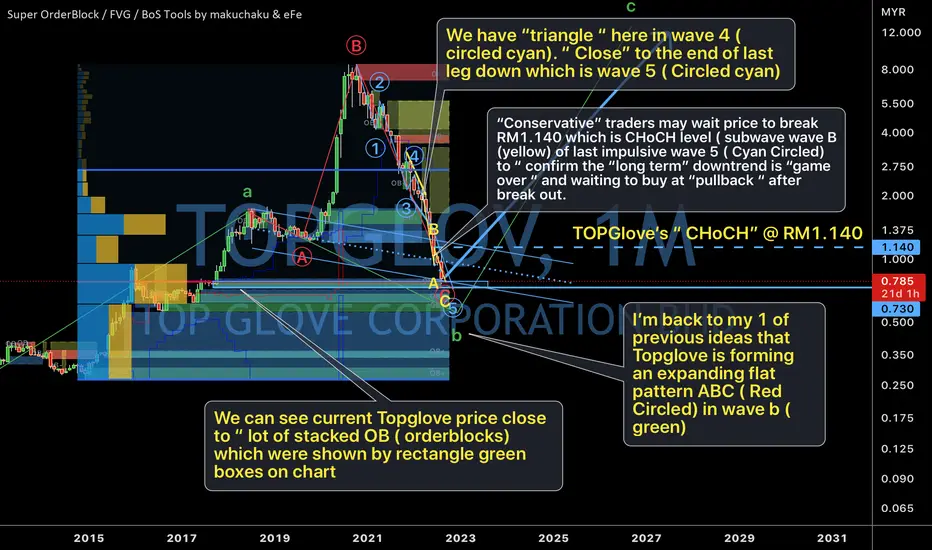
Topglove. Where is its orderblock & CHoCH lvl? 9/Sept/22Topglove “Conservative” traders may wait price to break RM1.140 which is CHoCH level ( subwave wave B (yellow) of last impulsive wave 5 ( Cyan Circled) to “ confirm the “long term” downtrend is “game over “ and waiting to buy at “pullback “ after the “ break out.”
A Divergence Signal!The candlestick indicates a low price momentum compared with the T-2 candlestick with the price closed above the opening price. Hence, the candlestick indicates a divergence signal where high volume momentum; crosses above the MA20 line.
MACD and OBV indicators indicate a divergence signal and confirm the price candlestick towards the MA20 line.
The price Point of Control (POC) of 0.840 will be a price resistance for today trading. If the price closed above 0.840 or 0.865then it will begin a price uptrend towards the MA20 line as new resistance.
To place a bid, use VWAP as a guideline and place the bid below the VWAP line or POC.
Let's save TOPGLOV in WL and watch out for significant price movement towards the next price resistance.
R 0.840, 0.865
S 0.795

Topglove. Where is its demand/ base / stop? 16/ August /22Topglove previous major demand / base / stop was created on 5 Sept 2017 monthly bar as shown on chart.

Topglove’s medium cycle analysis. 15/July/22.Topglov’s medium cycle 7 ( Purple) will be due anytime soon (as it was always between green/red vertical line ) and move up to cycle 8 ( purple) which is due by year end of 2022.

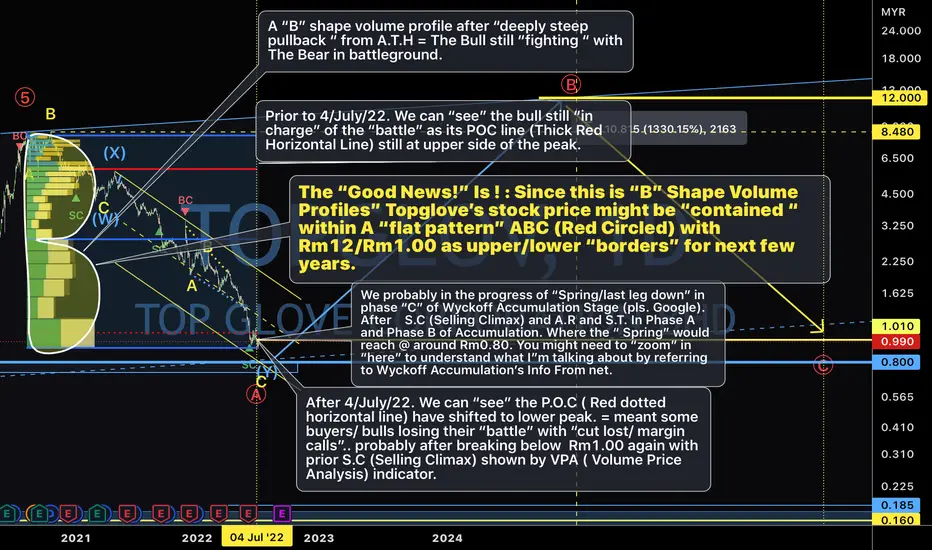
Topglove. Wyckoff Accumulation Stage. 15/ July/22.Topglove. Probably in “Phase C” of “ Wyckoff’s Accumulation Stage” moving down to Spring.( @ around RM0.90). With 3 Drives chart pattern.

Top glove. Finding its Ying/Yang force with channel. 14/July/22.Topglove (again). Today I gonna “bullsxxxing” a “myth” about ying ( seller force ) , Yang ( buyer force ) AND neutral force ( median line of parallel channel) again “represented” with parallel channel. P/s Since tradingview “free user” don’t have enough data feed. I have to “superimposed image” by using 3rd party apps to have more “history data” for “whole view” of its chart where it is still publishable in tradingview.

Topglove long term cycle analysis. 13/July/22.Topglove as the chart. Its long term cycle 13 (Green) is due slightly after green vertical line = it will be “bottomed” anytime now or by early 2023. Cycle 14 high ( Green) is @ the “middle” of vertical green and red line = Topglove will have “uptrend” until 2024/2025 min after it completed Cycle 13 ( Green) low.

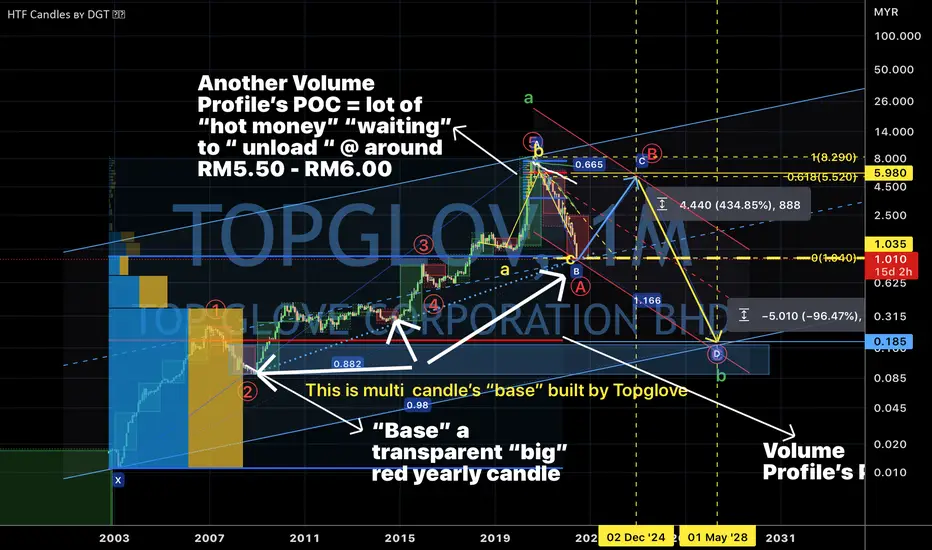
Topglove’s volume profile & Wyckoff method. 11/July/22.Topglove chart again!? It must be very “boring” as I “re-access ” my ideas again and again on Topglove chart..BUT since I personally invested on it I never treat my hard earned money lightly..
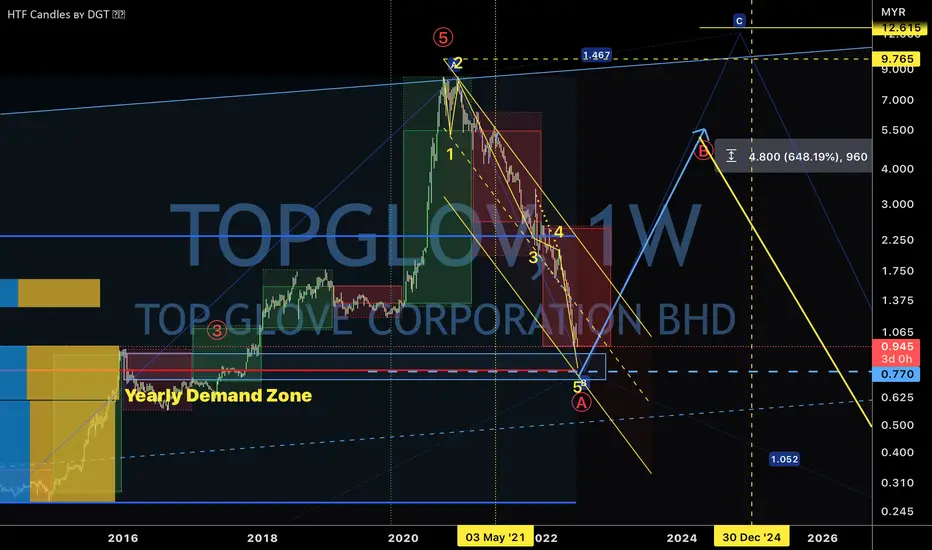
Topglove still possible breaking ATH in 3-5 years. 7/July/22Topglove. After re-checking Topglove z-factor ( the speed of its chart). . Topglove having “probability” to break its ATH within 3-5 years time.
Topglove next “stop” would be around Rm0.77. 5/ July/22.Topglove breaking “new low” again, the next “battle “ would be @ around Rm0.77 which is volume Profile POC and yearly demand Zone..
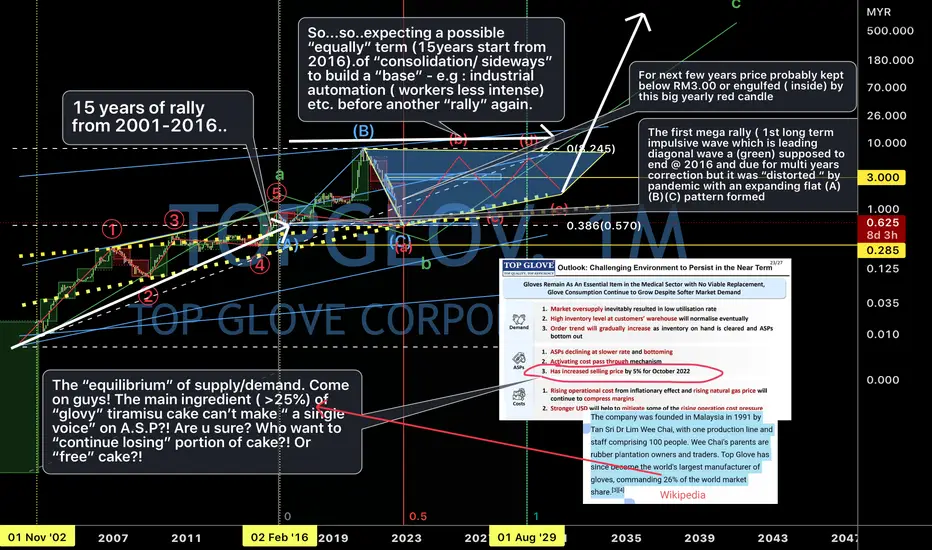
Topglove May <Rm 0.2 BUT maybe RM5-Rm6 first. 15/June/22Disclaimer : All past, current, future analysis are purely for “entertainment, research, studies” purpose only..TOPGLOVE. after “reviewing “ its price’s structure the initial expanding abc ( yellow) waves pattern idea which might “finished “ its “bearish correction “ most likely won’t happen. The current downward price movement from all time high look more like an downward impulsive 5 waves which is wave A ( Red Circled).. So..so.. there is a high “possibility” that Topglove will have another “deeper” leg down which is wave C ( Red Circled) where Price could ONLY “complete “ its “long term” correction probably @ around RM0.185. !!!!!??? BUT..but wave B ( Red Circled ) could “retrace” “ up to” around RM5.50 - RM6 which is Fibonacci 0.618 and Volume Profile POC....
Potential rebound soon!!??Week chart :
1 . Bottom pick show the signal.
2. Stochastic is oversold, and just the matter of time to rebound.
History will repeat itself.
DYODD & TAYOR
Disclaimer:
Mentioned stocks are solely based on own opinions for education/discussion purpose only. There's no buy/sell recommendation. Trading involve financial risk on your own.

Topglov “hit” 3 times “stop lost”! 27/May/22..Gosh! Topglove have hit 3 times stop lost from previous 3 ideas.. I just “found” but “not expected”. 4 valid “points” (as remark 1p to 4p in chart)..to keep my long positions.. Maybe..maybe Rm1.35 (again ) will be “bottom “ for many few years ahead..

Topglov reached 1.48! Either death or glory! 13/May/22Topglov price have reached Rm1.48 a “ border” of “ 4 = Death ( in Chinese ) or 8 = Glory ( in Chinese )..A possible 3 “touch & go “ or 3 drive pattern or wedge pattern’s lower trend line.

Topglove broke 1.65! Do traders contribute to society? 6/May/22Market Irrationality?! Topglove a cash rich / YOY earning profit stocks Price have broken Rm1.65 previous low! From Rm8.48.. that more than -80%!!! What next?! Look like the next level to build “a base” would be around Rm1.38...So.. what a role could be played be a traders now to based on “supply and demand” “helping” Topglove to have a “fair price”??? People make living in all kinds.. Some are good in talking, some are slow in talking but go deep into detail / analysis..But Society normally praise high those good talker..I have met an uncle who is able to sell a sea dog’s penis ( a myth as a sex boosters) for $1000, with the cost of only $5..Society especially eastern Society Regard Traders as “speculators” dealing with not “touching ground” “tangible assets”..Unlike western society most respect traders as highly sought professional.. ...Conclusion ( from net)..
Stock traders improve liquidity in the market by ensuring a fair price for buyers and sellers. This leads to fairer markets where the company shares rise according to the principles of demand and supply.
Liquidity in the market invests investment that adds value to the economic growth in society. The stock traders play an indirect role in the circulation of wealth in the social hierarchies essential for efficiency.

Topglove’s short term elliotwave updated 6/April/22Topglove’s price might have “pullback” toward wave 2 (yellow) @ around Rm1.820 which is 1) Fibo 0.618 retracement level 2) Volume Profile P.O.C ( point of control ) level Red thick horizontal line before.. A “strong” upticks..

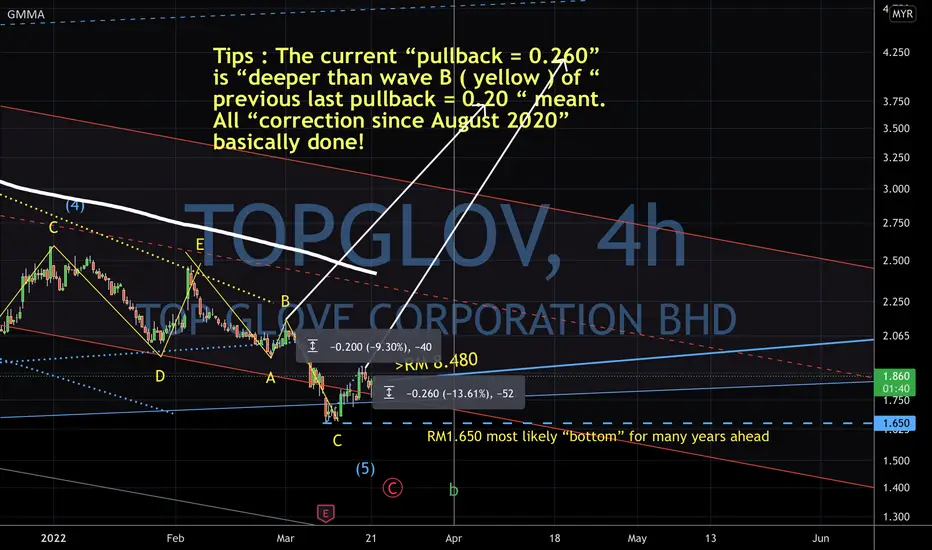
Topglove . Why “bottom” reversal? 21/Mar/22Topglove most likely won’t reach Rm1.60 as “projected target price” by some “Big Institutions”. Rm1.650 bottom most likely would be “bottom” for many years ahead..as mentioned on larger time frame chart on previous ideas. Here we checkout from smaller time chart. We have seen Topglove forming a triangle patter “ABCD” ( yellow) on its chart. Where triangle mostly happen on last correction in wave 4. ...Plus++ we have a deeper pullback than wave b (yellow) now.. confirmed a long term reversal from its last leg down of last subwaves abc (yellow)
Topglov most likely “bottom “ @ 1.650. 21/Mar/22Topglove. Checking from it’s smaller time frame wave structure, topglove most likely done its bearish correction since August 2020.. Beside “reversal pattern in smaller time frame) Topglove monthly Price was stalled at around lower support line of long term uptrend parallel channel ( cyan ) plus POC ( Red thick horizontal line ) of volume profile.

TOPGLOV Analysis(17 March 2022)(My analysis on Daily Timeframe )
-Price breakout the Trendline on Daily timeframe
-Current price will retest at Key Level/ Swap zone or maybe breakout
-Compression and another price action can be seen at lower timeframe
-Clean breakout at 1.985 support area +bullish compression appeared
My conclusion:-
Theres would be an opportunity if the price break key level/swap zone at 1.985 then if the price action shows a good sign,Need to wait for a price to retest at key level/swap zone 1.985 first then look for a price rejection around the swap zone and need to pay attention how the price approach at swap zone .Dont try to do anything If the price try to retrace at swap zone too fast/A lot of big bear candlestick appeared. The key is we have to look for a price compression appeared first when the current price is otw to approach at swap zone . After that just wait for a price rejection. If the swap zone is valid,my expectation is the price will do a rejection at 2.480 resistance area after the bull run. If my Price expectation 1 is not valid,theres another 2 price expectation that i show at the chart. Slow and steady,dont be greedy.
Have a nice day and stay safe everyone!
(Sorry my english is bad,i hope after this my english will become better)
''I AM NOT A FINANCIAL ADVISOR,EVERYTHING I SHARE IS JUST MY OPINION''

Topglove long term updated 10/ Mar /22 1)On Charts : Charts consist of 3-Dimensions - The X-factor ( Time or Cycle ), The Y- factor ( Price Geometry ), AND The Z-factor ( The Speed ).. 2)On Elliot Wave / Market Structure : Unlike Textbook written rule : ALL Impulsive wave comprise of ONLY a-b-c sub-waves NOT 1,2,3,4,5 waves.. AND there is NO Truncated 5th wave BUT ONLY wrong wave counts...
Disclaimer

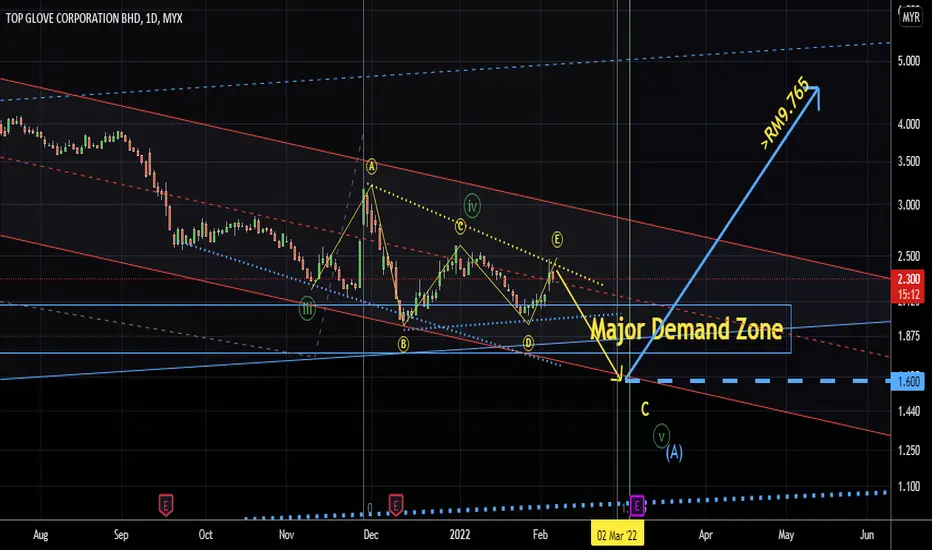
TOPGLOV possible on last leg of correction. 8/Feb/22TOPGLOVE. I've look back topglove's price structure, there is a high probability that it has just completed its wave E (Yellow circled) of a triangle pattern which happen most of the on wave 4 where most of the time the last waves of "correction" . That meant also TOPGLOV might on its last waves down toward around 1.600 before major "BULLISH REVERSAL! " probably just right after or before the 9 March 20222 1st Quarter Earning Report Announcement.