TOPGLOV "reversal" after CNY? 24/Jan/22TOPGLOV's "BIG BOSS" have "aggressively" "accumulated" "His" "Own Stocks" recently!!! Pls. checked "detail" at "attached" image on inside the "background" of this chart.
TOPGLOV trade ideas

TOPGLOV maybe Showering Heading South. 5/Jan/21..TOPGLOVE short term price structure seem like forming a head and shoulder pattern ( which is a bearish reversal signal) .. Price need to break above 2.780 which is the low of sub wave ii ( Cyan/ Light Blue) for any further validation setup before the Bull Continue running.

TOPGLOVE probably on last leg down to around RM1.80. 27/Dec/211)On Charts : Charts consist of 3-Dimensions - The X-factor ( Time or Cycle ), The Y- factor ( Price Geometry ), AND The Z-factor ( The Speed ).. 2)On Elliot Wave / Market Structure : Unlike Textbook written rule : ALL Impulsive wave comprise of ONLY a-b-c sub-waves NOT 1,2,3,4,5 waves.. AND there is NO Truncated 5th wave BUT ONLY wrong wave counts...


TOPGLOV. MAYBANK maybe "right" @≈ 1.80. 16/Dec/21Please like , share and comments , thank you!...Our "progression" are build on "constructive criticism".. Trade what we "see" not our expectation due to bias

TOPGLOV target hit as previously expected (Told you so)MYX:TOPGLOV has hit my second expected target of RM2.00 yesterday.
First target RM2.30 and was spot on achieved in early November 2021. I started following this name since November 22, 2020 and has been posting numerous posts and warnings of it coming down. Yet I get laughed at with people saying how can a profitable company fall to RM2 from a whopping RM7+ after bonus issue?
Well, look at how it fell. To me, whether the company is profitable or not, it doesn't really matter, because prices are moved by supply and demand. It doesn't matter at all if its a profitable company or not, fact is it is sliding down, the actual question you should ask is what are you going to do about it given that it is sliding down. Not sit there and continue to be in denial hoping it will make a comeback and continue to gather all possible news to support your bagholding. That's living in denial.
Hope we learn a lesson from this.
Expecting it to hover around RM1.80-RM2.00 for now. Wil definitely not buy this.

TOPGLOV short term updated 1/Dec/21It doesn't matter "omicron variant" gonna get "stronger" or "weaker" than "delta variant" Or Does it matter ASP ( Average Selling Price ) Gonna "cheaper". WHat do you think one of coming world worst inflation rate will make ASP go lower?...Glove's "Economic Cycle" Gonna to run and start the engine "making money"...


TOPGLOV "MAIN" view. 30/Nov/211)On Charts : Charts consist of 3-Dimensions - The X-factor ( Time or Cycle ), The Y- factor ( Price Geometry ), AND The Z-factor ( The Speed ).. 2)On Elliot Wave / Market Structure : Unlike Textbook written rule : ALL Impulsive wave comprise of ONLY a-b-c sub-waves NOT 1,2,3,4,5 waves.. AND there is NO Truncated 5th wave BUT ONLY wrong wave counts...

TOPGLOV alt view. Maybe ≈5.820 (only)..30/11/211)On Charts : Charts consist of 3-Dimensions - The X-factor ( Time or Cycle ), The Y- factor ( Price Geometry ), AND The Z-factor ( The Speed ).. 2)On Elliot Wave / Market Structure : Unlike Textbook written rule : ALL Impulsive wave comprise of ONLY a-b-c sub-waves NOT 1,2,3,4,5 waves.. AND there is NO Truncated 5th wave BUT ONLY wrong wave counts...

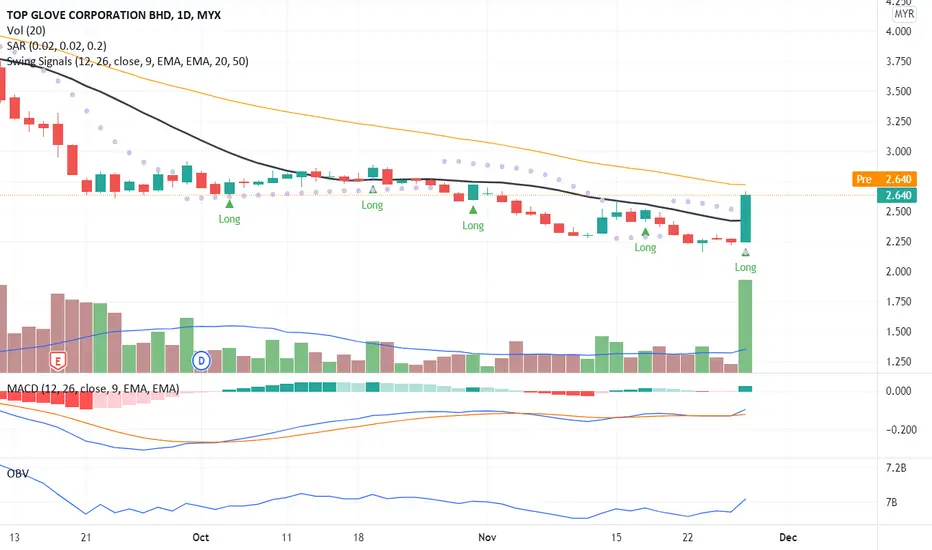
A Breakout Signal!Significant price movement due to buying interest makes the candlestick close above MA20. Hence, creating a price breakout signal with big volumes confirmed the trend after side-way for several trades.
MACD and OBV charts indicate a divergence signal. Therefore, the a high possibility of a long trade position. Will TOPGLOV will be having a price correction or continue the price up momentum?
To place your bid, use VWAP as a guideline and place your bid below the VWAP line.
Put TOPGLOV in your WL and watch out for price rally-up momentum.
R 2.72
S 2.24
TOPGLOV Not every candlestick pattern "count". where/when.28/11/TopGlove.. Not every candlestick pattern "counts" Depend on where/when it was "found"...Is is a "valid" counts?. A "doji"? A "Pin Bar" A "Good" Morning Star? on not 1 minute but monthly chart..?..( Wait,, Not yet), wait until it closed monthly bar after 30/Nov/21

TOPGLOV. TD Setup ( Timing System Used By George Soros).22/11/21TOPGLOVE weekly Price is on last waiting to closed weekly bar of TD ( Tom Demark) Countdown 13 ( Red)( Maybe at around RM2.15)... TD ( Sequential and Count Down ) .. A "Timing System) Trading System Used By George Soros, Paul Tudor Jones etc...The following paragraph ... used to be written in Wikipedia but now taken down....<<< Their creator, Tom DeMark, has served as consultant to such revered money managers as George Soros, Paul Tudor Jones, and Steven A. Cohen.">>>

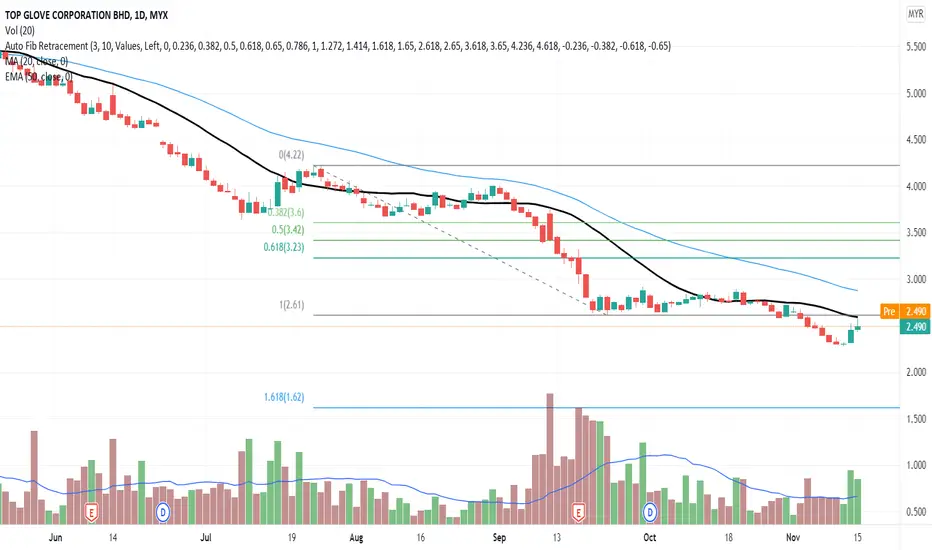
A Reversal Signal!Using Fibonacci Retracement chart, TOPGLOVE price in reversal pattern and trying to hit above MA20 line with volume above MA20. If the candlestick body closed above MA20, then it will be a uptrend pattern.
MACD and OBV charts indicate a divergence signal. Possibility of strong uptrend position.
Put TOPGLOVE in your WL and watch out for significant price movement with volume.
R 2.73
S 2.30
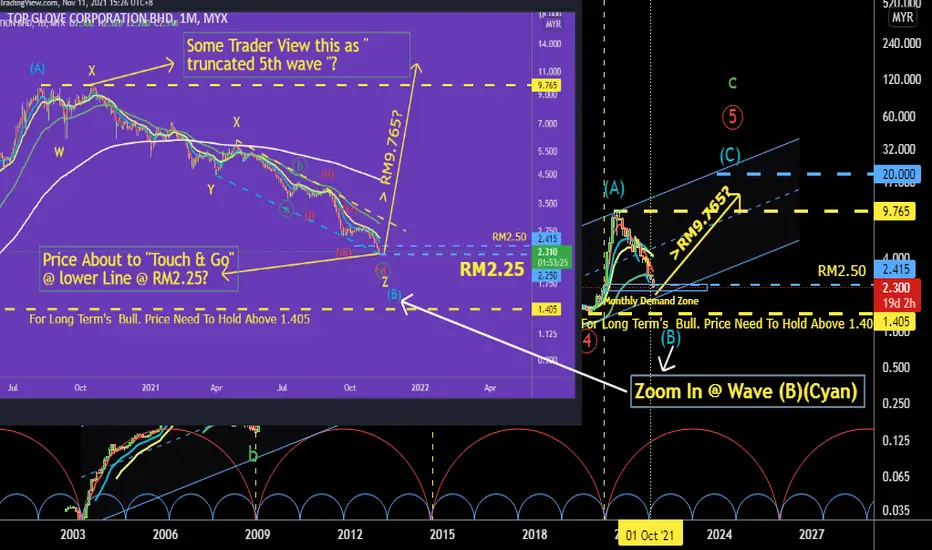
TOPGLOVE @ ≈ RM2.25?! 11/Nov/211)On Charts : Charts consist of 3-Dimensions - The X-factor ( Time or Cycle ), The Y- factor ( Price Geometry ), AND The Z-factor ( The Speed ).. 2)On Elliot Wave / Market Structure : Unlike Textbook written rule : ALL Impulsive wave comprise of ONLY a-b-c sub-waves NOT 1,2,3,4,5 waves.. AND there is NO Truncated 5th wave BUT ONLY wrong wave counts...
Told you so (TOPGLOV chart updates)Following up with my earlier post, MYX:TOPGLOV is moving as expected towards the RM2.30 area first, with some possible support at RM2.00-RM1.80 region.
Just would like to highlight that the "Dollar-cost-averaging" method only works with uptrending stocks. When you encounter stocks that are in an underlying downtrend, implementing the averaging down method will only cause more hurt than gain.
P/S: I do not rely on income statements, balance sheets or market news. In my opinion, the information the charts present is sufficient to easily tell the probabilities of the stock moving in which direction.

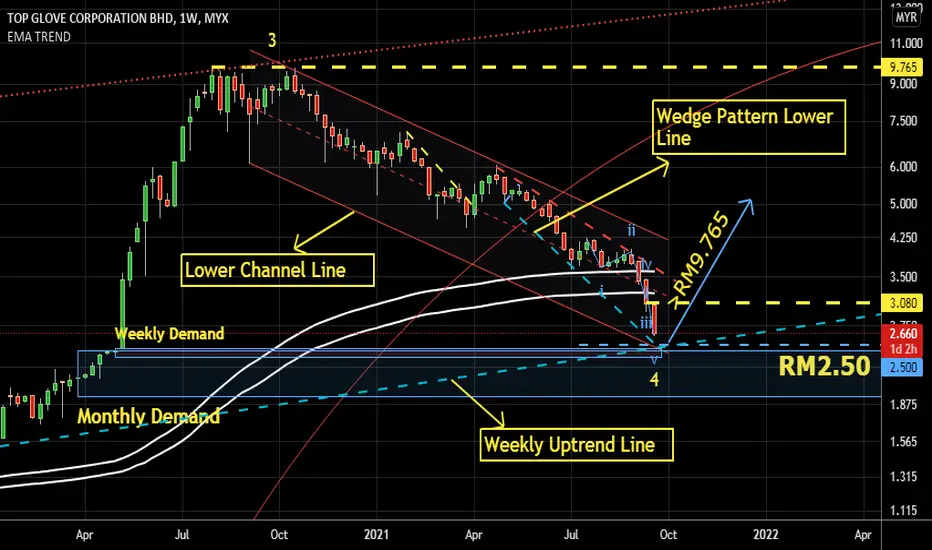
TOPGLOV's Wyckoff Analysis with Volume Profile + VSA. 3/Nov/21TOPGLOVE's stock price "Finally" reached RM2.50.. A "very critical support zone"... Where this "zone" are : - 1) Weekly Up Trend Line ( Cyan Dashed) support 2) Weekly & Monthly Demand Zone 3) Zone of lower support @ parallel channel (red).. AND From Volume Profile's POC @ around RM2.70.. we "see" lot of buyer either from institutional or retail were buying in That "matched" what Wyckoff's "Universal" Market Structure in "Accumulation Phase"...

TOP GLOVE FINAL CAPITULATION
top glove still in selling.
going for the bottom
curently TR bias to redistribution

TOPGLOV bounce soon?seem TG has some chance for a bounce
LOW is getting higher.
MACD crossover.
Price above 20MA.
support 2.75 , 2.67
major support 2.58.
note: overall trend is very weak.
success rate would be low

Glove counter short term tradeearly signal for reversal, provide an opportunity for scalping.
*SHORT TERM TRADE" 1:5 risk to reward ratio

RM3.2 is the next major bounce for Top GloveAfter a major spike, funds are taking profit and this may bring Top Glove back to the roof (around RM3.2) of its long term trading band for a major rebound.

TOPGLOV: Short rally - downtrend to continueSeries of rising wedges = result is the same - continue downtrend. This rally will be a short one.

TOPGLOV. Why 2.50? Not Maybank 1.80?! 23/9/21Why TOPGLOVE's RM2.50 price is the "MOST CRITICAL SUPPORT"?! It doesn't matter "Everyone" got to know RM2.50 is the BEST "OFFER SALE PRICE" It's "No secret"..Because even it's "disclosed secret" .. Still lot of traders won't believe it ...Show your chart Why Maybank Projected RM1.80 is "reasonable" ..
"TRADE WHAT WE SEE.. NOT WHAT WE EXPECTED" ...What I "See" RM2.50 are the confluence of 1) Weekly Demand Zone 2) Monthly Demand Zone 3)Weekly Uptrend Line (Cyan/Ligh Blue)..Support 4)Lowe Channel Line (Red) Support 5)Wedge Pattern Lower Line Support (cyan/light blue).. etc.. What else can we "see"?