TTVHB
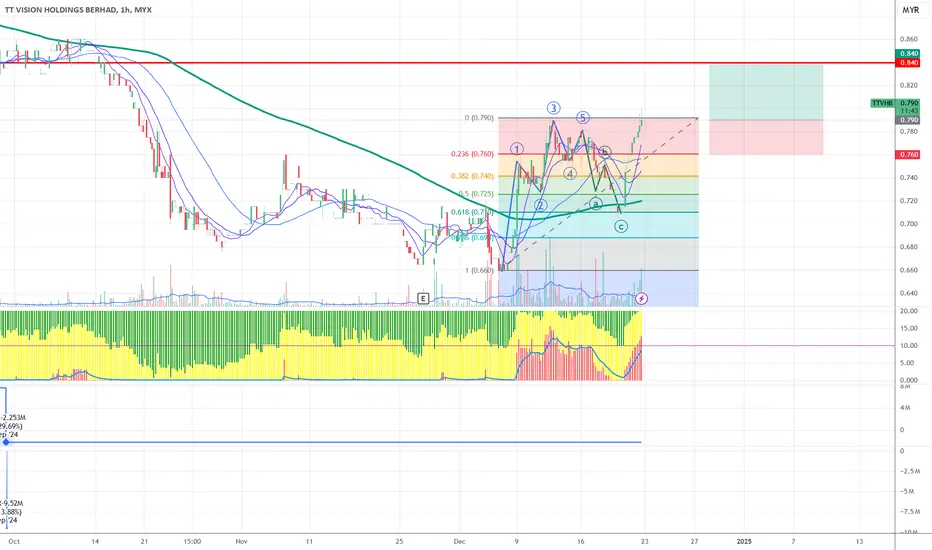
Breakout, pullback, entry? Why wait for pullback? Market moves by Fear & Greed of the participants (Day trader, Contra player, position trader, etc). Thats why we should always look for retracement around the key level after major moves to be safe. Don't chase, if she's the one she will come to f
Next report date
—
Report period
—
EPS estimate
—
Revenue estimate
—
0.015 MYR
3.80 M MYR
56.57 M MYR
145.08 M
About TT VISION HOLDINGS BERHAD
Sector
Industry
CEO
Koon Yin Goon
Website
Headquarters
George Town
Founded
2018
ISIN
MYQ0272OO003
FIGI
BBG01C5K1RY4
TT Vision Holdings Bhd. is an investment holding company. It operates through the following geographical segments: Malaysia, China, Hong Kong, Philippines, and United States. The company was founded on March 21, 2018 and is headquartered in George Town, Malaysia.
Related stocks

TTVHB making 3rd wavei put stoploss below the horizontal level of peak 1st wave, as i feel this is impulse wave
wave 3 will go up, and even if it retrace as wave 4, it will not move below peak of wave 1
A Positive Divergent Signal!The candlestick pattern indicates a positive divergence since the stock is in the accumulation stage before proceeding to an uptrend movement. The upper limit triangle-like shape indicates price resistance when prices move up the result of the price action should increase in volume.
The MACD and RS

KLSE : TTVHB (0272)HM signal (High momentum) spotted. Looking good with increasing volume and momentum.
Manage to break out the previous high with higher volume and support at good level @ 0.780 - 0.800. It is likely to trend higher if the momentum continue to rise from here.

TTVHB Simple Chart AnalysisTTVHB - Rst 1.37 & 1.7 Supp 1.21
Lookout if can breakout to go 1.7 or prepare to collect at support during retracement. Either way
How to view the guidance via chart ( Refer back to pin message guidance if to trade )
Red Line = Support
Blue Line = Resistance
Light Blue = bullish/bearish patter

See all ideas
Summarizing what the indicators are suggesting.
Neutral
SellBuy
Strong sellStrong buy
Strong sellSellNeutralBuyStrong buy
Neutral
SellBuy
Strong sellStrong buy
Strong sellSellNeutralBuyStrong buy
Neutral
SellBuy
Strong sellStrong buy
Strong sellSellNeutralBuyStrong buy
An aggregate view of professional's ratings.
Neutral
SellBuy
Strong sellStrong buy
Strong sellSellNeutralBuyStrong buy
Neutral
SellBuy
Strong sellStrong buy
Strong sellSellNeutralBuyStrong buy
Neutral
SellBuy
Strong sellStrong buy
Strong sellSellNeutralBuyStrong buy
Displays a symbol's price movements over previous years to identify recurring trends.
Frequently Asked Questions
The current price of TTVHB is 0.580 MYR — it hasn't changed in the past 24 hours. Watch TT VISION HOLDINGS BERHAD stock price performance more closely on the chart.
Depending on the exchange, the stock ticker may vary. For instance, on MYX exchange TT VISION HOLDINGS BERHAD stocks are traded under the ticker TTVHB.
TTVHB stock has fallen by −2.52% compared to the previous week, the month change is a −3.33% fall, over the last year TT VISION HOLDINGS BERHAD has showed a −47.75% decrease.
We've gathered analysts' opinions on TT VISION HOLDINGS BERHAD future price: according to them, TTVHB price has a max estimate of 0.78 MYR and a min estimate of 0.78 MYR. Watch TTVHB chart and read a more detailed TT VISION HOLDINGS BERHAD stock forecast: see what analysts think of TT VISION HOLDINGS BERHAD and suggest that you do with its stocks.
TTVHB reached its all-time high on Jan 18, 2023 with the price of 1.700 MYR, and its all-time low was 0.350 MYR and was reached on Mar 4, 2025. View more price dynamics on TTVHB chart.
See other stocks reaching their highest and lowest prices.
See other stocks reaching their highest and lowest prices.
TTVHB stock is 3.54% volatile and has beta coefficient of −0.25. Track TT VISION HOLDINGS BERHAD stock price on the chart and check out the list of the most volatile stocks — is TT VISION HOLDINGS BERHAD there?
Yes, you can track TT VISION HOLDINGS BERHAD financials in yearly and quarterly reports right on TradingView.
TT VISION HOLDINGS BERHAD is going to release the next earnings report on Aug 27, 2025. Keep track of upcoming events with our Earnings Calendar.
TTVHB net income for the last quarter is 5.70 M MYR, while the quarter before that showed 6.60 M MYR of net income which accounts for −13.62% change. Track more TT VISION HOLDINGS BERHAD financial stats to get the full picture.
No, TTVHB doesn't pay any dividends to its shareholders. But don't worry, we've prepared a list of high-dividend stocks for you.
As of Aug 4, 2025, the company has 136 employees. See our rating of the largest employees — is TT VISION HOLDINGS BERHAD on this list?
EBITDA measures a company's operating performance, its growth signifies an improvement in the efficiency of a company. TT VISION HOLDINGS BERHAD EBITDA is 13.50 M MYR, and current EBITDA margin is 12.78%. See more stats in TT VISION HOLDINGS BERHAD financial statements.
Like other stocks, TTVHB shares are traded on stock exchanges, e.g. Nasdaq, Nyse, Euronext, and the easiest way to buy them is through an online stock broker. To do this, you need to open an account and follow a broker's procedures, then start trading. You can trade TT VISION HOLDINGS BERHAD stock right from TradingView charts — choose your broker and connect to your account.
Investing in stocks requires a comprehensive research: you should carefully study all the available data, e.g. company's financials, related news, and its technical analysis. So TT VISION HOLDINGS BERHAD technincal analysis shows the neutral today, and its 1 week rating is sell. Since market conditions are prone to changes, it's worth looking a bit further into the future — according to the 1 month rating TT VISION HOLDINGS BERHAD stock shows the sell signal. See more of TT VISION HOLDINGS BERHAD technicals for a more comprehensive analysis.
If you're still not sure, try looking for inspiration in our curated watchlists.
If you're still not sure, try looking for inspiration in our curated watchlists.