UWC LIKELY TO HIT 7.95 BEFORE START ITS CORRECTIONUWC, a beautiful stock, has good rallies after sharp correction of pandemic outbreak happened in first quarter of 2020.
The stock prices movement are likely moving within ending diagonal pattern to eventually ends its wave 3 at ballpark value of 7.95. Once wave 3 is done, will expect a sideway consolidation correction.
Suggest to take profits.
Happy trading!
UWC trade ideas


Uptrend UWC - sesuai untuk orang berkerjaAnalisis ringkas:
- Strong support diantara MA 21 dan MA50
- Kaunter Uptrend
- Sesuai untuk untuk yang target 10%-15% sebulan
- Apa -apa monitar candlestick dan volume bila nak entry, dan trading plan
TAYOR


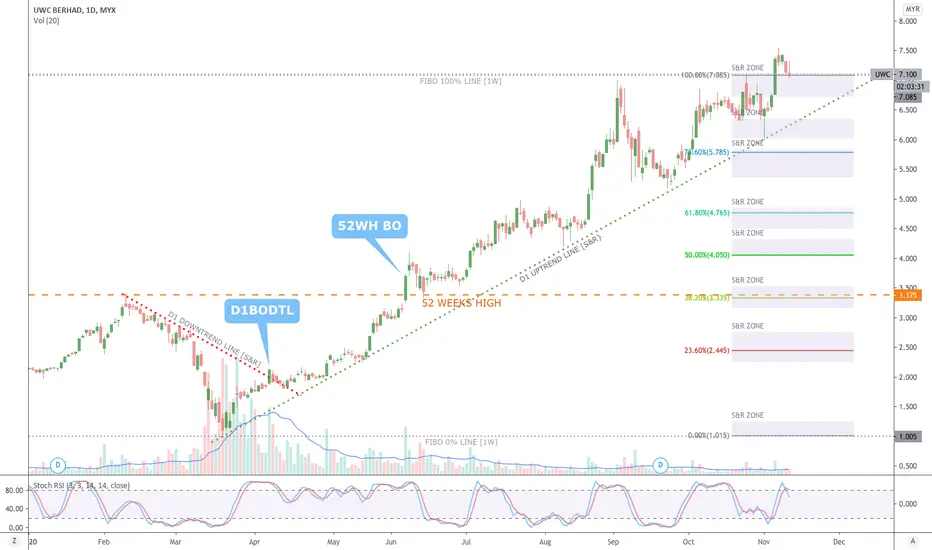
UWC [11 November 2020] Buy On Dip in Support ZoneMYX:UWC
SWING: 2 DAYS TO 2 WEEKS
Breakout Downtrend Line
52 Weeks High Line
Fibbonaci Retracement
Candlestick Support & Resistant Zone
Trendline Support & Resistant
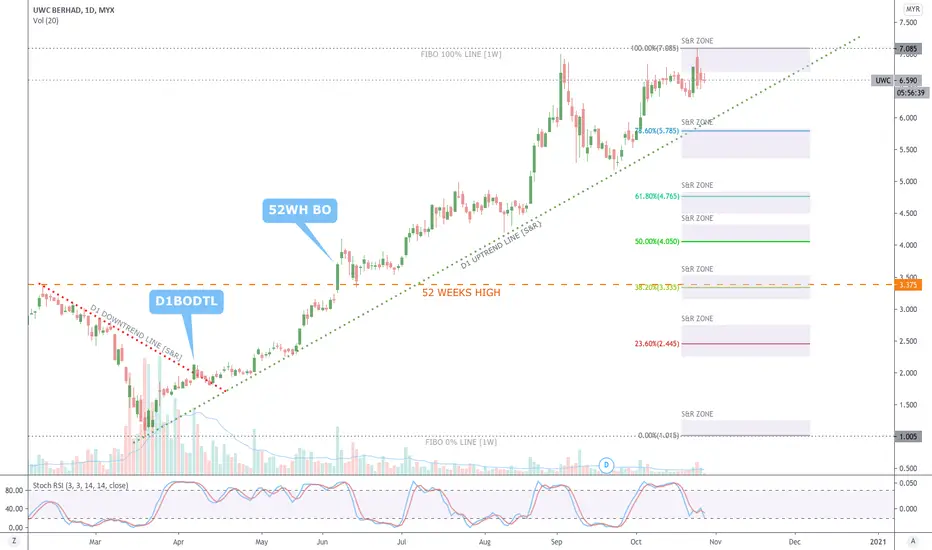
UWC [27 October 2020] Buy On Resistant Zone Break OutMYX:UWC
SWING: 2 DAYS TO 2 WEEKS
Breakout Downtrend Line
52 Weeks High Line
Fibbonaci Retracement
Candlestick Support & Resistant Zone
Trendline Support & Resistant
BEAUTIFUL CUP & HANDLE FORMATIONWaiting to break the handle position and then breakout All Time High soon


UWC - Hoovering near supportBullish, Uptrend.
ATOM Neutral or sideway,
FiFT +ve / MCDX+ Banker's bar > 75%
Option.
Accumulate near support/BoD.
Further buy on Breakout.
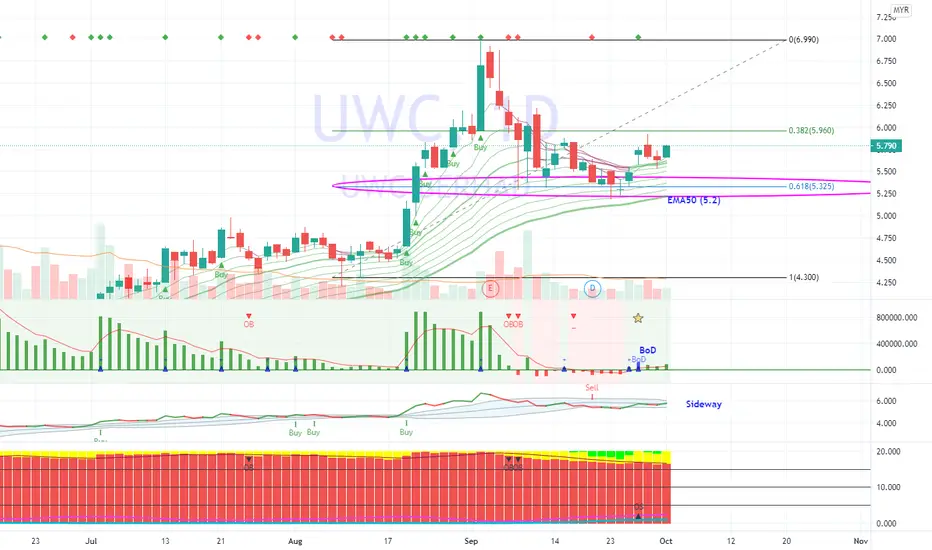

UWC - Sign of Pressure UWC
Rst: 6.84
Spp: 6.0
Shooting star candlestick emerged right from Fibo Extension 161.8%, usually stock tends to take a rest once extrapolate from Fibo Ext 100% - 161.8% zone. But this is not the end of bullish cycle yet, it may retrace and if can survive above 100% zone, the uptrend will continue.

UWCMarket sentiment is bullish
Technology sector fast turtle buy
MYX:UWC
Candlestick pattern: Morning star
Waiting for fast turtle buy 5.84
FIFT turn green soon, bull will in control again since global market bullish now.
Still in uptrend, Atom turn green.
Reversal start soon road to RM7 or higher again.


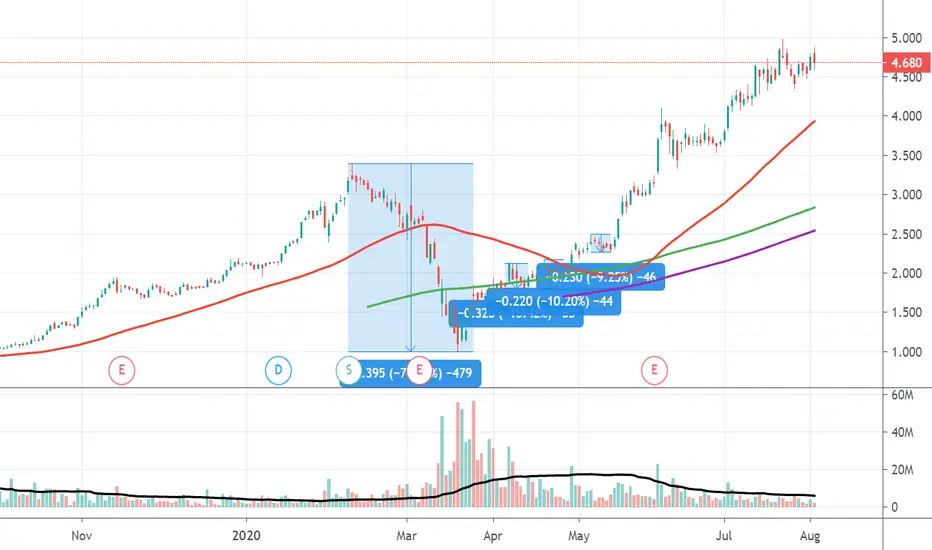
UWC 5/8/2020UWC has been riding on a solid uptrend line. Almost every time when it touched the trend line, it immediately climbed back up and chart higher. After a few days of minor correction, it seems to be forming a ascending triangle.
EP: 4.690-4.700
TP: 5.170
CL: 4.550


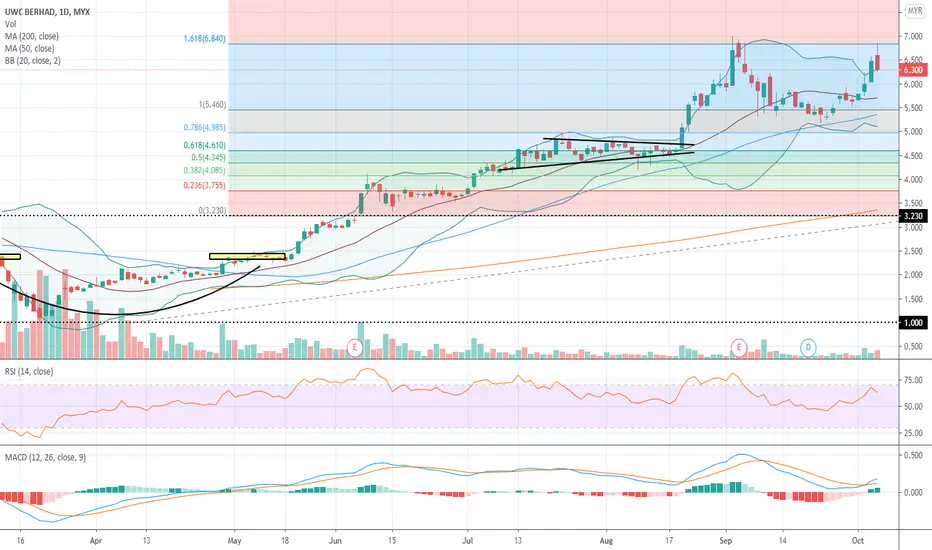
UWC - How Far Can The Rally Progresses?UWC
Rst: 4.98/ 5.46
Spp: 4.61
Bullish symmetrical triangle breakout, at the same time propelled the stock from Fibo Ext 61.8%, the surging Bollinger Band will continue to induce upside for the stock.
Do you want to know how far the bullish trend can last?
Join our premium channel to learn from our coach today, contact MR ED 012-9022474

UWC - Analisis Gelombang ElliottUWC
Kelihatan telah menyiapkan 5 gelombang kenaikan. Overall nampak UWC adalah satu saham yang sangat bagus dan kenaikan yang sangat impulsif.
Kini kenaikan mungkin bakal berakhir. Sasaran awal adalah pada bahagian atas saluran menaik.
Sekiranya UWC memecahkan paras RM4.48 sen, admin berpendapat bahawa harga akan terus menuju ke bawah.
Abang Doji.


Homily Chart Trend Expert and MultiDragon Chart MCD SimiliarityMultiDragon Chart (MCD) - 70% similar with homily chart
[Hot Money Indicator is an indicator based on specific formula to detect Institutional/Banker investor activities..
Red means Smart Money Flowing in
Green means Retailer
Preferable to have RED more than GREEN to go long.
Trend Expert (TE) - 90% similar
Turtle Resistance - 20 Days High
Turtle Support - 10 Days Low
EMA20, EMA50 and EMA200 in 1 indicator
