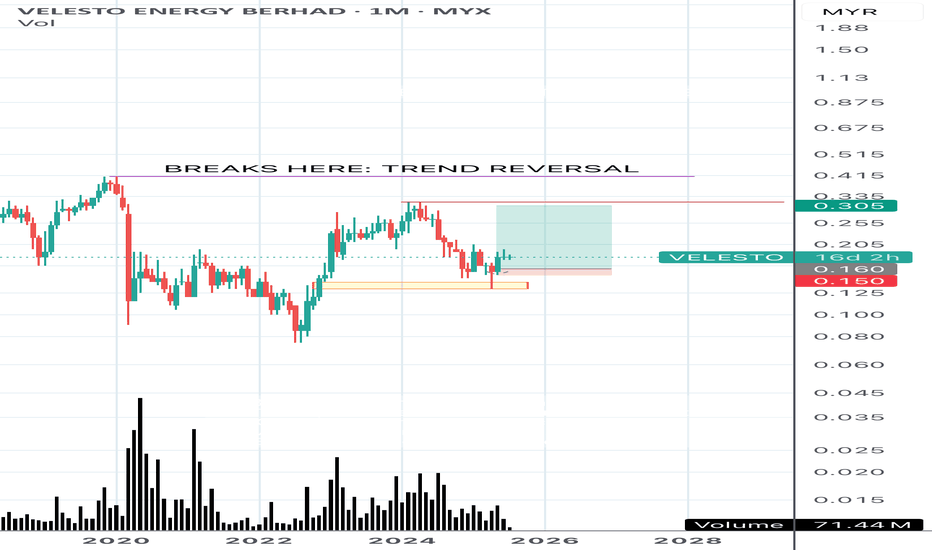
VELESTO trade ideas
VELESTO buy signal based on MRV1 setup on 4 Jan 24 at RM0.240
This is a repeated signal that was triggered on 26 Dec 2023 at the closing price of RM0.230.
The support area could be established at the equilibrium support area of RM0.215.
Suggested stop loss at RM0.205 to comply with the minimum risk of 10% based on the price.
The target price is at RM0.280 with a 1:2 risk/reward ratio, aligning with the equilibrium resistance price area or RM0.285.
Adjust the risk/reward ratio to 1:1.5 or 1:1 based on preference.
The expected holding period is 2-3 months as the signal is derived from the daily chart.
This information is for discussion purposes only and is not a buy/sell call.
Velesto, entering a strong resistance zoneVelesto, after reached my target price 0.220, now entering a strong resistance zone from RM0.225 to RM0.280.
RSI at 81.30 consider strong selling zone and certainly not a safe zone to enter new position.
For those who wish to participate in this uptrend can wait for price retrace back into RM0.180 to RM0.160 with stop loss setting at 0.140.
Disclaimer: Stock analysis by author are solely for entertainment and educational purpose. They do not represent the opinions on whether to buy, sell or hold shares of a particular stock. Investors should be cautious about any and all stock recommendations and should consider the source of any advice on stock selection. Various factors, including personal or corporate ownership, may influence or factor into a stock analysis or opinion.
Emerged of Buying Interest!Due to published news for the RM13m deal, there is significant buying in hence the price closed the MA50 line backed by significant volume compared to the previous trade.
MACD and OBV indicators confirm the price uptrend towards the next resistance price which is the MA200 line.
Precaution for a price correction between 10% - 20% from the recent peak where it may be primed for a trend reversal or corrective price pullback.
Let's save VELESTO in WL and watch out for a price uptrend towards the next resistance price which is the MA200 line.
R 0.115
S 0.085
MYX: VELESTO. Time to upclimbing?Fundamentally,
1. on August 25, 2021 QR was released with Net profit 207% (YoY) & 127% (QoQ)
2. Institutional purchase of shares on August 17, 2021.
3. Current crude oil trending.
Technically,
1. inside uptrend channel, wave b just completed and expected to hit wave c till 23sen.
As always, TAYOR !
regards
Abenoor
Disclaimer: No trading strategy provided here. Our content is intended to be used and must be used for technical analysis & education purposes only.
Bullish SignalsVelesto is in the cusp of breaking Resistance level R1 at 0.19, however there are many evidence that Bullish momentum is strong as seen on DMI preceded by earlier Exhaustion Gap, V-bottom and violation of a valid DTL. The price subsequently moving above the Resistance turns support level, followed by another Bullish Flag formation as another continuation Bullish signal. Should the price moving above resistance at 0.19, our price target is at 0.25 (TP1) and 0.35 (TP2). On the opposite scenario, price movement below 0.16 could push the price lower.
Disclaimer: Our content is intended to be used and must be used for technical analysis education purposes only.


