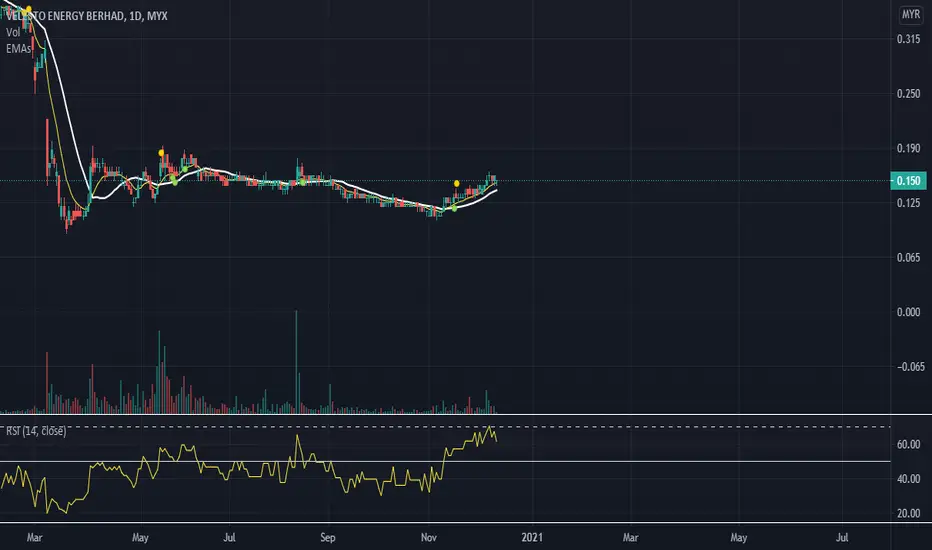
VELESTO AnalysisDisclaimer: This is not a buy call but for learning purpose
Technical analysis
Still in accumulation phase
Volume is OK
Potential uptrend continuation
RSI & ZL-MACD is above the centerline
Trading idea (Long term play. Need to hold)
Entry price: 0.150
Cut loss: 0.135
TP1: 0.170
TP2: 0.190
TP3: 0.210
VELESTO trade ideas
Bursa VELESTO Energy Berhad - LongtermI personally take this for long-term into the portfolio, but if for short-term then they are few prices / zone we could look for pitstop to TP. Look for re-entry according to the pullback or retracement price.
Disclaimer: If you choose to follow this trading idea you do so at your own risk after giving thorough and reasonable thought and consideration to your actions. All trading is high risk and one of the most difficult activities you will ever consider. Don’t trade with money you can’t afford to lose.


meneruskan kenaikanUntuk terus mengekalkan kenaikan
price perlu maintain atas 0.170
pecah 0.185 FLY
monthly
Stochastic oversold-buy signal
RSI buat bullish divergence
nampak mmg boleh swing dari bawah
daily
stochastic buy signal
RSI area 50% good momentum

Velesto EnergyNow running profit when 1st entry at 0.13.
Pullback area suggest @ 0.16 and 0.15.
Juz hold and peram for this minyak counter

<TradeVSA> Velesto testing support before Mark-UpStrength signal in the chart:
1. Accumulation
2. High volume pentagon bar
3. Low volume back to support
Hit the "LIKE" button to support us :)
Disclaimer
This information only serves as reference information and does not constitute a buy or sell call. Conduct your own research and assessment before deciding to buy or sell any stock


Triangle and Rectangle chart patternLong term Trading view (Descending Triangle chart pattern)
Lower lows create
Higher lows create
=Expected lower low create
Short term trading view
tripper top created in red resistance
expecting to be short

VELESTO, Retracement to MA and Fibonacci ConfluenceBias: Bullish. After touching high of 0.410, price retraced and seemed to found support at green MA. The 38.2% fibonacci level was briefly violated but managed to close at exactly 0.365. #pullback
Stop-loss: 0.350
// 50% price retracement.
1st target: 0.410
// Previous high as resistance.
Gentle reminder: Plan the trade and trade the plan. Trade at your own risk. Stay tune!
Guys, if you like the idea, please "like" it, this will be the best thanks.
If you have any questions or trading ideas, please post them in comments!
Thank you for your support, we appreciate it.

<TradeVSA> Shakeout with Volume in Velesto. Continuation soon...Strength in the chart:
1. Re-accumulation with shakeout
2. Green pentagon with volume appeared :)
Hit the "LIKE" button to support us :)
Disclaimer
This information only serves as reference information and does not constitute a buy or sell call. Conduct your own research and assessment before deciding to buy or sell any stock

<TradeVSA> Strength with Supprt at Velesto & Velesto-C28Strength in the chart:
1. Potential pullback
2. Mark-up in the background
Disclaimer
This information only serves as reference information and does not constitute a buy or sell call. Conduct your own research and assessment before deciding to buy or sell any stock


[Watchlist]Hari ini banyak kaunter-kaunter yang merah.
Kaunter ini mengalami penurunan dan memecahkan paras
sokongan fibo 78.60. Stocastic indikator menunjukkan paras
oversold.
Perhatikan pergerakan harga pada minggu ini. Cari peluang
untuk entri sekiranya indicator stochastic memasuki kembali
gelangan 20 dan keatas.
Entri di sekitar 0.265 dan keatas, target 0.28 dan 0.310


VELESTO. (Ascending Triangle to be broken)Make or break. An entry around .290 /.295. Worth holding as Oil price will have a direct impact on price

UMWOG - When It Can See The Sunlight Again?Laburlah Technical Coverage (06-APR, Friday):
UMWOG
Technical Analysis Breakdown
1. Trend: Bearish
2. RSI & Stochastic: Bearish
3. Bollinger band: Widening/ heading south
4. Remarks: Broke down crucial support @ 0.27
5. Selling pressure: Intensifying
Disclaimer: The abovementioned is purely for sharing purpose, you should seek advice from relevant personnel and do your own analysis before making your move.

UMWOG breakout from a rounding bottom.1. Rounding bottom breakout
2. Price currently supported at FR 38.2% = 0.405
3. Another stronger support seen at FR 61.8% = 0.36.
4. The target for the next extension will be around 0.48 - 0.525.
