Wellcal Holdings Bhd to Challenge ALL TIME HIGH?A bullish continuation pattern can be seen as the price continuously making series of Higher Highs and Higher Lows.
For the past 2-3 months, price formed a pullback after the Break of Structure reaching RM 1.87 as the new 52 Weeks High.
There are three key things that are worth to be observed:
1.
Next report date
—
Report period
—
EPS estimate
—
Revenue estimate
—
0.09 MYR
46.91 M MYR
209.40 M MYR
341.97 M
About WELLCALL HOLDINGS BHD
Sector
Industry
CEO
Sha Huang
Website
Headquarters
Pusing
Founded
1996
ISIN
MYL7231OO003
FIGI
BBG000PQFHT9
Wellcall Holdings Bhd. engages in the manufacture of industrial rubber hoses and related products. Its products are used for the air and water; welding and gas; oil and fuel; automobile; ship building; and food & beverage applications. The company was founded in 1996 and is headquartered in Pusing, Malaysia.
Related stocks

WELLCALL. AlgoSignal reveals potential uptrendSeveral indicators within my algorithmic system are signaling a potential uptrend. These include:
- Increased volume: Activity is picking up, suggesting growing interest and potential momentum.
- Mid- to long-term uptrend: Both the 50-day and 150-day exponential moving averages are pointing upward,

WELLCALL. Uptrend based on AlgoSignal StrategyThe current point exhibits promising upward signals according to my algorithmic system, meeting various criteria. These include rising trading volume, an upward trend indicated by prices above EMA20 and EMA50, and the closing price surpassing VWAP. As a result, the present conditions suggest a poten


Monthly, Weekly, Daily projection on WELLCALLThis is based on monthly, weekly and daily analysis.
If you're buying, green zone is the TP
If you're selling, red zone is the TP
Monitor for price reaction at every zone, either the candle reaction in that zone want to breakout the zone, or the candle reaction want to test/pullback at the zone.


Wellcall - break upWellcall - break up done, Up trend may continue
VT Stock indicator is a stock breakout trend indicator for identifying the change of Mid to long term trend direction
(Disclaimer: for demonstrating own planned trade records study only and education purpose, not for recommend to buy or sell. Trade a

VCP SETUP WELLCALLA strong base company,in industrial product sector.supported by institutional.Increasing sales and profit QOQ and YOY.Price just breakout from pivot point with high volume
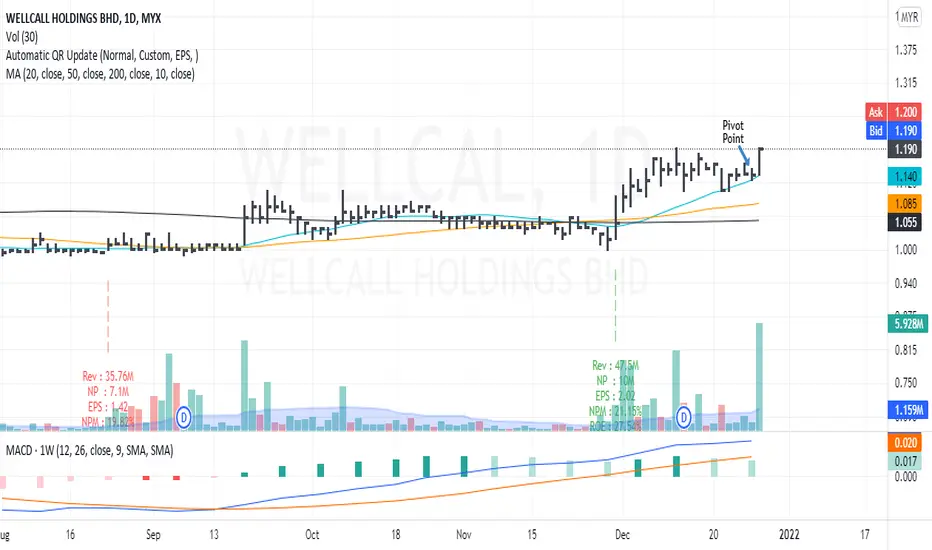
Price maintain above MA linespossible retest support level at 1.19 and continue moving upward..we'll see

Wellcall long term down trend breakaoutMYX:WELLCAL
1. Price chart breaking long term down trend line since 2016.
2. Breakout from sideway box 1.13. If back test can stand above 1.13, uptrend more convince.
3. MACD and RSI good positive look.
4. Volumne analysis show no major resistant until 1.25.
Once break and stand above 1.25 can b

See all ideas
Summarizing what the indicators are suggesting.
Neutral
SellBuy
Strong sellStrong buy
Strong sellSellNeutralBuyStrong buy
Neutral
SellBuy
Strong sellStrong buy
Strong sellSellNeutralBuyStrong buy
Neutral
SellBuy
Strong sellStrong buy
Strong sellSellNeutralBuyStrong buy
An aggregate view of professional's ratings.
Neutral
SellBuy
Strong sellStrong buy
Strong sellSellNeutralBuyStrong buy
Neutral
SellBuy
Strong sellStrong buy
Strong sellSellNeutralBuyStrong buy
Neutral
SellBuy
Strong sellStrong buy
Strong sellSellNeutralBuyStrong buy
Displays a symbol's price movements over previous years to identify recurring trends.
Frequently Asked Questions
The current price of WELLCAL is 1.33 MYR — it has increased by 1.53% in the past 24 hours. Watch WELLCALL HOLDINGS BHD stock price performance more closely on the chart.
Depending on the exchange, the stock ticker may vary. For instance, on MYX exchange WELLCALL HOLDINGS BHD stocks are traded under the ticker WELLCAL.
WELLCAL stock has risen by 1.53% compared to the previous week, the month change is a −0.75% fall, over the last year WELLCALL HOLDINGS BHD has showed a −17.90% decrease.
We've gathered analysts' opinions on WELLCALL HOLDINGS BHD future price: according to them, WELLCAL price has a max estimate of 1.72 MYR and a min estimate of 1.62 MYR. Watch WELLCAL chart and read a more detailed WELLCALL HOLDINGS BHD stock forecast: see what analysts think of WELLCALL HOLDINGS BHD and suggest that you do with its stocks.
WELLCAL reached its all-time high on Feb 25, 2016 with the price of 1.93 MYR, and its all-time low was 0.20 MYR and was reached on Jul 18, 2006. View more price dynamics on WELLCAL chart.
See other stocks reaching their highest and lowest prices.
See other stocks reaching their highest and lowest prices.
WELLCAL stock is 1.53% volatile and has beta coefficient of 0.99. Track WELLCALL HOLDINGS BHD stock price on the chart and check out the list of the most volatile stocks — is WELLCALL HOLDINGS BHD there?
Today WELLCALL HOLDINGS BHD has the market capitalization of 662.27 M, it has decreased by −1.50% over the last week.
Yes, you can track WELLCALL HOLDINGS BHD financials in yearly and quarterly reports right on TradingView.
WELLCALL HOLDINGS BHD is going to release the next earnings report on Aug 25, 2025. Keep track of upcoming events with our Earnings Calendar.
WELLCAL net income for the last quarter is 8.23 M MYR, while the quarter before that showed 13.29 M MYR of net income which accounts for −38.03% change. Track more WELLCALL HOLDINGS BHD financial stats to get the full picture.
WELLCALL HOLDINGS BHD dividend yield was 4.74% in 2024, and payout ratio reached 76.43%. The year before the numbers were 4.83% and 64.86% correspondingly. See high-dividend stocks and find more opportunities for your portfolio.
As of Jul 26, 2025, the company has 420 employees. See our rating of the largest employees — is WELLCALL HOLDINGS BHD on this list?
EBITDA measures a company's operating performance, its growth signifies an improvement in the efficiency of a company. WELLCALL HOLDINGS BHD EBITDA is 72.48 M MYR, and current EBITDA margin is 33.28%. See more stats in WELLCALL HOLDINGS BHD financial statements.
Like other stocks, WELLCAL shares are traded on stock exchanges, e.g. Nasdaq, Nyse, Euronext, and the easiest way to buy them is through an online stock broker. To do this, you need to open an account and follow a broker's procedures, then start trading. You can trade WELLCALL HOLDINGS BHD stock right from TradingView charts — choose your broker and connect to your account.
Investing in stocks requires a comprehensive research: you should carefully study all the available data, e.g. company's financials, related news, and its technical analysis. So WELLCALL HOLDINGS BHD technincal analysis shows the neutral today, and its 1 week rating is sell. Since market conditions are prone to changes, it's worth looking a bit further into the future — according to the 1 month rating WELLCALL HOLDINGS BHD stock shows the sell signal. See more of WELLCALL HOLDINGS BHD technicals for a more comprehensive analysis.
If you're still not sure, try looking for inspiration in our curated watchlists.
If you're still not sure, try looking for inspiration in our curated watchlists.