XNO - With a possible parabolic movement!XNO is getting hotter, seen from the higer highs and higher lows which trend is breaking the 1.75$ level.
Is a good barrier to break but with a bit of volumes the price can go towards the first potential possible targets around 3$ a piece.
Good trading!
NANOUSDT trade ideas

✴️ XNO Bullish Flag (194% - 380% Profits Potential)Good day my fellow Cryptocurrency trader, one more chart for you today.
➖XNOUSDT can be seen here consolidating within a bull flag, which is a continuation pattern.
➖The initial move is a bullish breakout in late 2023, so the continuation points to an up-move.
➖A potential bullish continuation is supported by a strong RSI with XNOUSDT moving weekly back above EMA100 (blue line on the chart).
This might have been a mixed chart if it wasn't for the move above EMA100 this week. Confirmation is needed though.
Potential targets mapped on the chart.
Namaste.

XNO LOOKS BULLISHFrom where we entered "strat" on the chart, we have had a double correction on the chart that has been over for some time.
Now there is a good place to rebuy. If the price reaches the green range, we will enter the buy/long position
By keeping the green box, it can continue to pump in the coming days.
The targets are clear on the picture.
Closing a daily candle below the invalidation level will violate the analysis
For risk management, please don't forget stop loss and capital management
Comment if you have any questions
Thank You

XNOUSDT.PXNOUSDT.P is in bearish trend.
Potentially printing LH and LL.
No sign of reversal here.
Buyers are storngly active.
We didn,t wait for the breakout we sell at CMP.

Benford's Law Applied to Nano (XNO)I have already introduced the Law of Anomalous Numbers, also known as Benford's Law. While using a Logarithmic price scale helps give perspective to the change in price over time, I have added additional lines equally spaced at each magnitude to further clarify price action.
I first split each magnitude in half by taking the square root of 10, which equals 3.16. Applied to financial markets Benford's Law suggests price should spend half the time between 1*10^x and 3.16*10^x and the other half of the time between 3.16*10^x and 1*10^(x+1), etc. Despite this representation, we are only concerned with the leading digit, so price does not have to spend an equal amount of time at each magnitude. The longer the period of time and orders of magnitude in price we measure, the greater the likelihood the leading digit will gravitate toward the power law distribution seen below. We should note that subsequent digits appear to follow this distribution as well but gravitate toward a uniform distribution the further away we measure from the leading digit. This is independent of the base number system used and can most easily be understood using a percent change perspective.
The probability of leading digits:
P(1) = 30.1%
P(2) = 17.6%
P(3) = 12.5%
P(4) = 9.7%
P(5) = 7.9%
P(6) = 6.7%
P(7) = 5.8%
P(8) = 5.1%
P(9) = 4.6%
Legend and how each number can be derived but arranged in numeric order:
sqrt(1.78) = 1.33 light blue
sqrt(3.16) = 1.78 purple
1.33*1.78 = 2.37 pink
sqrt(10) = 3.16 red
1.33*3.16 = 4.21 orange
1.78*3.16 = 5.62 dark green
2.37*3.16 = 7.50 light green
10 dark blue
Next order of midpoints in gray
I find it interesting how midpoints, midpoints of midpoints, etc., seem to consistently interact with price as support and resistance rather than just being an arbitrary number along a supposed random walk. If we continue to take midpoints of midpoints infinitely, we will naturally fill in every number. We then gather that the most significant number is 1 (across magnitudes), followed by its midpoint (3.16), followed by the midpoints of the midpoint (1.78 and 5.62), followed by the midpoints of midpoints (1.33, 2.37, 4.21, and 7.5), etc. Market pressures force price in one direction or another but seem to shift or alleviate around these and other midpoints until that pressure subsides or other pressures arise. These price levels are not the cause yet are interconnected with the effect as seen on this chart and others.

Bullish for XNO AT any Time soon will explodei believe that this coin will hit soon more than 5 dollars
but if you scalp quickly
you can buy between 1:04 to 1:08
and sell between 1:28 to 1:48

XNO (Nano) may be setting up for an explosive moveXNO has a history of explosive movements. Fibonacci extensions point to possible targets after the $1 price is left behind. To put it in perspective, at current values, XNO should be worth $90 to catch up with the memecoin Doge and $37 for Shiba. To enter the top 100 of the crypto market capitalization it would need to be worth $4. I believe it is a great risk-return if you believe in the technology, distribution and use of it, especially now that people are noticing flaws in Bitcoin and Lightning Network.

XNO below 1$ for 230 daysXNO can be traded at less than a dollar for 230 consecutive days now. Great for accumulating more. 😉

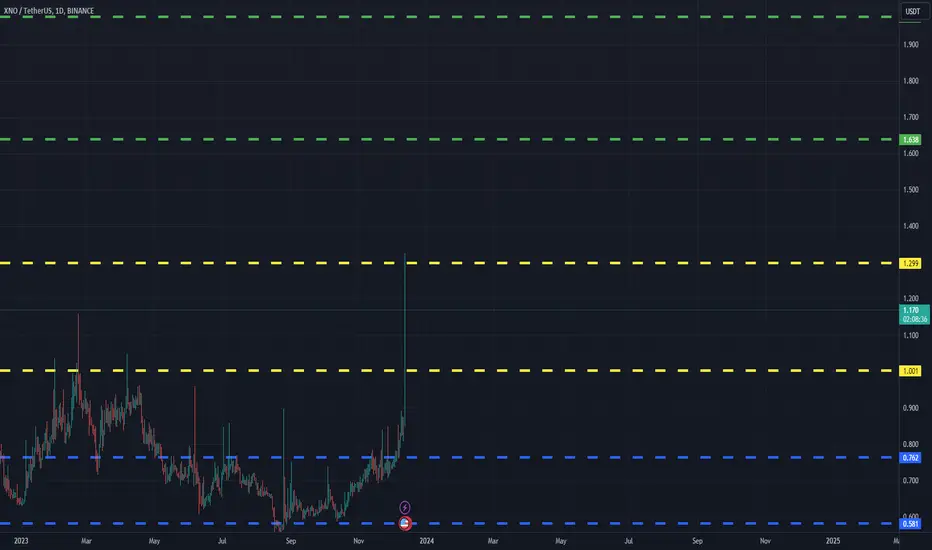
XNOUSDT(Nano) Daily tf Range Updated till 12-12-23XNOUSDT(Nano) Daily timeframe range. lots of wicked out in this PA. cut through 1.001 and need to stay above to get out of 1.299 which already touched. thats only possible if daily close dont end up in another wicked out.
XNO divided by USD money supplyI found it amusing how well the horizontal channel can be drawn in XNO/USM2. Additionally, it seems that the long-term downtrend is finally about to break. It's a pity that such a great project still receives so little attention.
This is not trading advice.

SCALPNano might see 3ish % drop even tho theres quite a lot emas on the way but they'r just imaginary anyways right
lets see what hamas brings 4 us
allahu akbar
htf looks bullah but i bet its a fake n we go down

finally xno breaking multi year downtrend in downtrend since 2021 but now showing signs of life formed falling wedge in 3 days tf and also breaking multi year trendline expecting successful breakout
and incase of successful breakout expecting solid recovery towards 2$ in next weeks keep eyes on for successful breakout

XNO 4h Bullish if and only if XNO looks very promising and I believe it will reach a profit of 2% at least from the current price.
If it stays above the light blue colors then we expect a good move upward insh Allah!
SL 4h below the red line.
All the Best!

XNO showing a very impressive investment opportunityHi Everyone;
today we have one of the best risk to reward Investment opportunity
it is more than 3000 times the risk and the chart is look very promising.
I expect breaking the previous bear market key point will clear the way to the final target

Leverage longgoing long with 10x leverage, this is part of a bigger structure. see my account for more info. You can tell by the MACD this will try soon to break form this short term downtrend. im convinced it wil. normally i dont leverage trade.


XNOUSDNot an investment recommendation.
This chart was made for personal study and personal use only.
If you liked the idea, please like it.
If not, write why.
In my humble opinion, the price will go up.

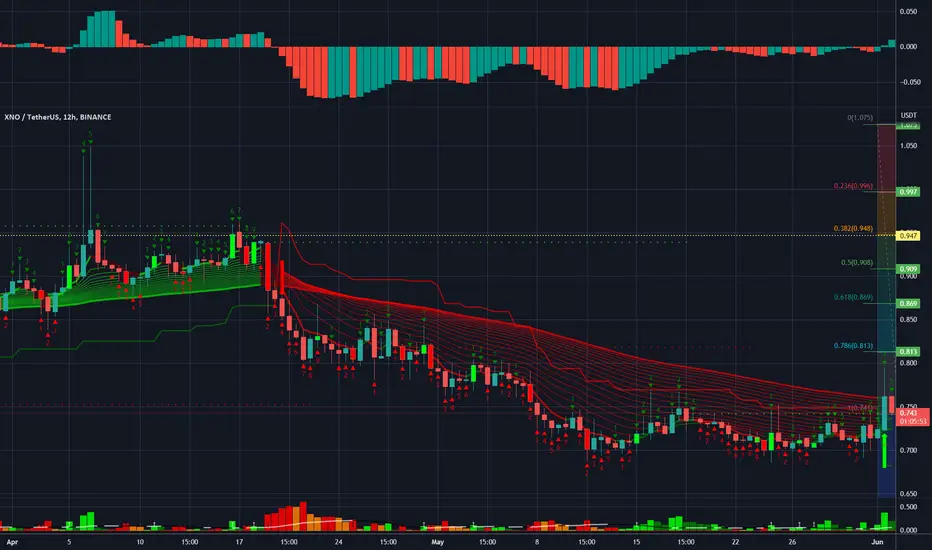
XNO Signal and targetsToday XNO is bullish and prints out a nice 12h candle and quickly pullbacks
The AO indicator on this chart turns also bullish (upwards)
Also we can see the current pullback is exactly on the support area(while writing this)
If XNO maintains this support and keep a bullish momentum,
Then eventually the price will rise and hit some targets.
⛧smthngs up⛧this golden baby has been slapped harder than others, it's always the good ones ⛧
sure there's always the zero behind the corner.
So small cap , no cap.
4,20 is good number
13 also
so why not 33 and 69
some numbers

XNO USDT idea - will XNO follow HIGHXNO USDT idea - will XNO follow HIGH ?
When you like what we do give us Boost and comment!
And follow: womenincrypto48
Join the Revolution!
Women in Crypto - WiC48
May you have more profit than you could ever wish for !

XNOUSDTEW point 5 isn't quite perfect. Bullish divergence is showing up.
S&R line with the descending trend line need to be hold before any longs can be opened.
Keeping an eye on the price action for now.

Hoping it doesn't come to this, but possible retracement to ATLNANO could see a final move down to 0.32 region, where the covid crash found its low before starting a new cycle upwards.

Nano coin getting ready for a pump (NEW)Nano (XNO) is consolidating in a downsloping channel which most likely will break out to the upside.
We don't expect this coin to make a new ATH in the next bull market but reaching 4$ in a mid-term is very likely which would be almost 400 % profit from the current price.
It's time to DCA into XNO.
