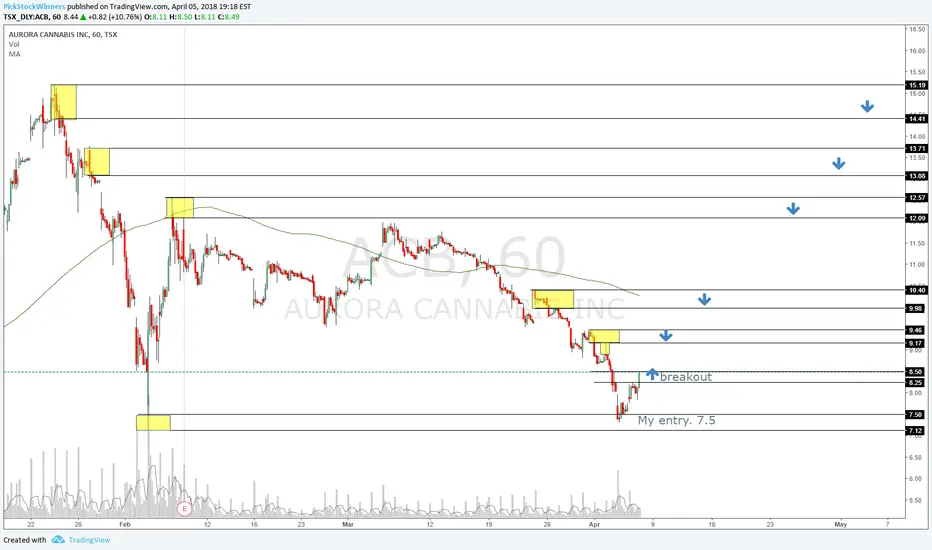
ALERT: ACB breaking out bullish from bounce!On this stock, stay long on bullrun and go sidelines on bear raids. It's a heavily traded stock with great price swings. The technical bounce predicted on April 9th for the 10th occurred and was then supported by bullish news from the Whitehouse supporting States like Colorado and Washington with recreational marijuana on April 13th. Bears should look at past chart action to understand this is not a good time to be short on this high volatility stock. To fuel the bull run on Aurora, the recent acquisition of CanniMed provides it with a lot of bragging rights including 72,000 litres of cannabis oil for both medical and recreational use as well as revenues in the $1.5B per year or more. The acquisition appears to have come in much lower than the January 2018 news releases. To add to bragging rights, Aurora has secured sponsorship rights to the famous Canadian 420 Celebration held each year in large and small cities around the country. It's held April 20th of each year. This year's celebration will be a day long affair Canada-wide. If you want evidence these stock run up on hype, watch what happens this week and into next week. Perfect trading opportunity.
On the just charts level, we have lots of runway to go and test the next serious resistance of $9.84. Given all the pending news and exposure with this sector and particular stock, don't be surprised we blow right through all the resistance into the $10s.
All traders need to remember this is a highly speculative and volatile sector. Charts provides the trends but cannot predict stock prices.
Please perform your own analysis and feel free to comment on mine. I'm a student of the markets and my quest is to learn each and every single day. Don't fall in love with your position, don't overtrade and take as many valid inputs for your trades as you can.
ACB trade ideas

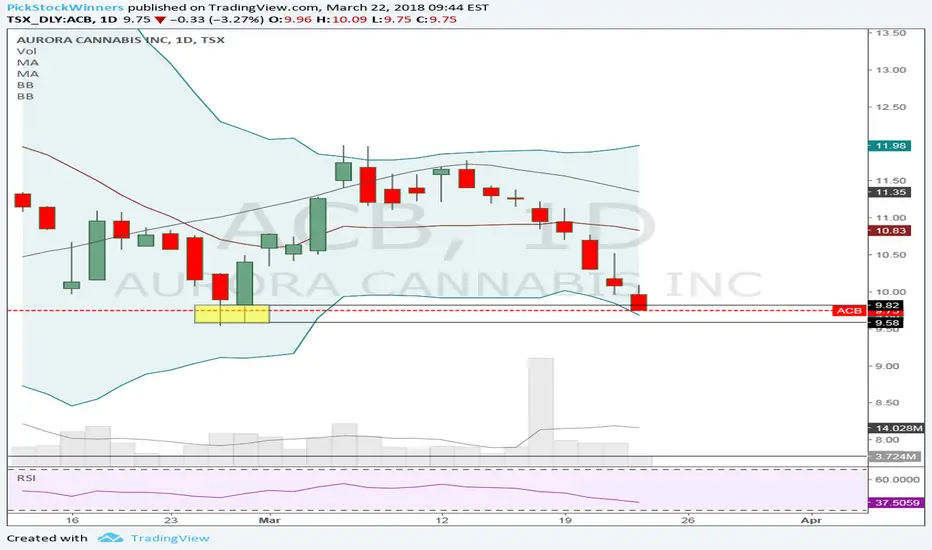
ACB - Very mixed signals but due for a bounce Not the type of charts that shows a lot of confidence either way. This stock rebounds from oversold but the selling might continue for a few sessions and might continue in its intensity. Creating and even more pronounced bounce. Numerous sequential bearish articles on this stock has helped it reached these levels. Insider buying has yet to have any positive impact on market sentiment. Very strong support in the low $7 as a base for the technical bounce.
1-Month Low $7.30
14 Day RSI at 30% $7.24
13-Week Low $7.11
Pivot Point 1st Support Point $7.10
38.2% Retracement From 52 Week Low $6.98
Pivot Point 2nd Support Point $6.81
Highly speculative but extremely rewarding when traded at the right time.

Should break tomorrow. Up HopefullyOpposite of APH the 100 MA on the 30 min chart was boosting us. However that is slowly moving further and further away. There is very strong support at 7.95 and then 7.85. If we ever hit 7.85 again I would be throwing my entire bank roll at it for a bottom fishing play. The resistance here is between 8.15 and 8.20. The channel is extremely tight and is setting it up for a big impulse move. I will be glued to this for what direction it finally breaks but overall its as if the last two days didn't happen. Two big Doji candles on the daily. It is my belief that we are waiting for WEED to finally break and hold 28.50 and finally breaking 29.00. If I see that Ill snatch up ACB as it will go along for the ride at a much cheaper Share Price.

Do or DIe... Potential Big WinnerACB closed right on a very large support. The 100 30 min MA that has been rejecting all WEED stocks is literally right on top of it. The slightest move up and we could run. A break of 8.20 would also send us straight to 8.50. A break of this could see $9.00. I think this is all contingent on WEED breaking that 28.50 barrier. I say this because when WEED broke 27.50 we ran. Everytime WEED broke 28.00 we shot up again. I am going to be watching this first thing and if we do break and hold 8.20 I will be moving my money from CRON here.
If we lose the battle we should bounce around 7.80 or 7.65.

Have we finally busted out of the downward Channel?Morning will Tell. In my opinion yes. Weed and the others should drag ACB out. I drew the white and Yellow Lines back in mid March and they have held up until now. ACB did drop back down just inside the channel but a great open should turn that yellow line into resistance. I wouldnt buy this one until that is confirmed. You are looking for a break of 8 and a retest there. I will be looking to buy on the second touch of 8. Looking at the daily between 8.15 and 8.20 we should see some resistance followed by 8.50 and 9.00. I think this is still the weakest of the Big 4 right now and there are better choices. A break and hold of 8 should see a nice green day if we cant bust through or lose 8 expect it to sink.

ACB - Double Top - Heading to $2-3Can't believe I missed this earlier with Aurora Cannabis. We're heading downwards to the $2-3 range. Oh well, win some and lose some. My focus is usually on Crypto and it takes my attention away from other stocks. Sharing my two cents and hoping this helps someone.

Make or Break for ACBDidnt like how ACB closed weaker than the other 2. However it is normally the laggard of the bunch lately. If the other 2 rocket they should pull ACB with it and it could once again be the steal. I can see 7.39 holding nicely as you have 14 supports some dating back as early as the start of Dec, However if it doesn't you will see this hit that 200 day MA at $6.21. Boom or bust here with a good chance at a reward. If you are looking to buy set your stop at 7.25 and hope for the best. I will be playing the bounce but I wont be holding for more than a day at a time.

Weekend Weed StocksLooking at the Charts ACB and APH are in much worse Shape than WEED and Chron. WEED lost both its 50W and 100 day MA though. You are going to want to see it break 28 again and hold on the daily.
You could see WEED and Cron Recover and APH and ACB and APH fall. TBH i wont trade until i get a clear signal Monday. Overall sentiment is down but SPY seems to be holding. We held up well Friday vs the declining SPY but we could be playing catchup Monday Morning.
ACB (200 day support 6.25) APH (support $10.00)
WEED
Expect a battle between 27 and 28. Winner will send it back to 30 or down to 25
CRON
Sitting on support from Tuesday. Could see it retest 7 however I feel like it might be the strongest.
SPY looking ok right now and Monday morning will tell the tale if we need to still play catchup on Friday's late dump or if we are going to head back up with it.

Aurora Cannabis medium-term buyHedge Funds and other companies are investing heavily in the Cannabis sector, and this company is relatively cheap. Which means that those companies investing in the sector are incrementally accumulating their positions. This also means that those companies will purchase stocks where they believe it to be cheap and that entry area is a good area (based on technicals) to purchase.

Tipped its hand with the SPYNailed it yesterday saying it was the laggard and will make up ground. I expect WEED to do the same tomorrow.
This stock and APH are 100% following the SPY less an hour. I swear some algorithm from the bigs have set it to follow the SPY minus an hour to the T. Start on the 15 min chart on the SPY roll back to 12:30. Then look at this at 1:30
It goes Red, Red, Green, Dump Red x3, Recovery Green Red Green. Huge Push 2:30 to 3 (SPY) 3:30 to 4 ACB. I was able to catch this when I seen ACB tank and the SPY was taking off and made out huge.
Closing Candle was very Strong I expect a Gap up open followed by a break of 11 and then a bit of a drop and consolidation. Keep an eye on how the SPY is doing and if you see it soaring and this tanking its time to buy the DIP!
I expect Pushback at 8.70 but this should run to test the 100 day MA in the near future. It was quite the run however so after a Gap up expect it to come back down to set a new floor Most likely at where it opened.

Not out of the woods yet but should correlate with the othersFinished strongly and the SPY is looking very healthy.This one you are looking to bust 7.77 and hold 7.62. 8.00, 8.25, 8.50 could all be sticking points. If it correlates with the other Big 3 and this is the laggard ready to break out this could be a major steal. Higher Risk Higer Reward here.

Looking for a nice bounce hereSimilar to my APH writeup. This stock should see a nice open after the SPY. It has touched the bottom of its channel as well which should increase its chances. FIB is saying this should hit I will be watching this stock at 8.50, 8.95 and 9.20 to see if it starts to go sideways before exiting.

ACB- Correction over breakout coming.You can see that a triangle is forming and that the trend line the fib and the .5 fib are all hitting the c point. This should be enough to start an uptrend. Also the macd looks like it is begiing to cross over soon.

ACB crosses the upward trend line, can it reverse?We have closed below the upward trend line, and out of the falling wedge. The weakness of the reaction rally foreshadowed the sharpness of the decline that followed. If we cannot hold support at 9.00 and start to form a reversal. If not, we will most likely test 8.50. Today hit support and got rejected twice, Will this be a reversal or will it continue to test lower?


Value area under 10.00I am watching the two forces bullish and bearish on this one. As you can see on the daily, we have very defined channel zones. Price is respecting these areas. The pot market is mostly bearish, with decent retracements aka bullish pullbacks (from bearish bias perspective). These are tradeable (I trade them as a counter-trend trade) and typically I see, 1.50 to 2.00 movements. A high probability tradeable pattern has emerged. Currently, I am watching for price to slip back to the 10.00 area of interest.
In my opinion; ACB is no longer trading like a speculative market, but now as a supply and demand market. As we appear to have a great deal of supply, suppliers are reporting how they can easily meet supply targets. Prices are set by the government, and supply chains are now emerging. I am expecting/predicting prices to keep slipping until August.
The days of 15% moves are gone, but we are seeing consistent days of 3% moves and over 3 or 4 days, that's an easy 9%-12% on a bullish week. I can live with that.
I have also noted, that possibly we have some whales shorting this market. The other day I was watching order flow, I noticed some large buying orders in higher price areas, from a bearish perspective, this would be whales taking profit on the big shorts.
A tip for risk management; Never trade with capital you cant afford to lose. Once you place a trade, assume it to be gone. If you can't live with that, then you shouldn't be trading with that much capital. Simple enough.
This is not financial advice, but purely my opinion and shared thoughts.

Aurora bounced off resistance, but faces heavy resistance.We can see that TSX:ACB just can't seem to keep volume or momentum. Although it had traced all the way back down to the .618 Fibonacci retrace, where it finally found some support and did a little bounce, but there is now heavy resistance it will have to face at 10.60. It is following the temporary downward trend line, indicated by the dotted green line, coming to a triangle where the upward trend line meets current support at ~9.57. We can confirm some new light support if the next couple candles close at somewhere around, or above 10.00.

Aurora didn't even get high and still needs support.Aurora didn't get as high as the other stocks, rather ending the last few days in the red. Forcing me to remove the previous support I was worried about, as well as the possible new upward trend line, replacing it with a dotted green temp downtrend line. It didn't recover well from that broken neck. There wasn't much of a shadow and the candle closed almost full red, indicating that we may still be headed in that direction. We will probably see 10.80 and possibly 10.50, as we closed below all three MACD's according to Bill Williams.

Going up soonThis stock will jump up in the coming weeks or two, as the RSI is always bouncing back and forth, and it has broken the resistance line so currently it will be going down but soon it will come back up. The RSI will jump up soon to indicate that the stock will head up, and the MAC will be touching soon showing that it will be going up. This is looking good for anyone that is interested in investing, Pay attention to the news relating to this stock since anything can happen.

FlaggingAurora Cannabis has been flagging in the past few weeks. It seems it could resume higher soon.

ACB HUGE BREAKOUT COMING (Aurora Cannabis)Inverse head and shoulders pattern has formed on the daily chart for ACB. It has tested a bottom three times and has been in tight consolidating patterns for the last 21 days -- the longest period of consolidation yet in the stock's history. Bollinger bands have tightened signaling a nearing breakout, with bear volume reducing and bull volume increasing, signaling an imminent breakout to the upside.
Whether you check the weekly or the daily chart, the inverse head and shoulders pattern has completed and the stock is signaling a strong upwards movement.
On the weekly chart we've formed higher highs three weeks in a row with increasing bull volume. Anticipate huge volume next week and a breakout.
