Repeating Pattern #VolatilityWatchNeckline (outlined in blue) for inverse Head and shoulders.
Harmonic Cypher pattern @786 retracement, where ADMA bounced.
RSI moving up with trend, showing strong accumulation (Bulls in control)
Highlighted in the blue box's is a pattern that I've been watching for awhile now. As you can see, they are very similar and just so happens that today's close was pushing up against the top of the neckline for the head and shoulders.
Seems ADMA could have a significant move within the next few days
Also, for those who aren't familiar with ADMA, they do have an announcement/PR for one of their lead products - Bivigam, to launch... Coming soon =)
Please like and follow so I can continue finding awesome charts. Thank you in advance everyone d=)
Disclosure: I am long ADMA. This is not a note to buy or sell, please do your homework before investing.
ADMA trade ideas

ADMA - MP @short % float 14% if this drops near 4.70s will be hoping for a dead cat bounce and I will be watching all levels of past support

Long ADMA, Bullish PinThe recent high from ADMA's recent FDA approval may seem to be dying out, but there is a strong support line at
Support line has been tested three times at around $5.00. Although it has been tested quite rapidly, within a 4 day period, this seems to be a good indication that we have found our new support line.
This makes the bullish pin even more prevalent and accurate.
ADAM to shoot up.

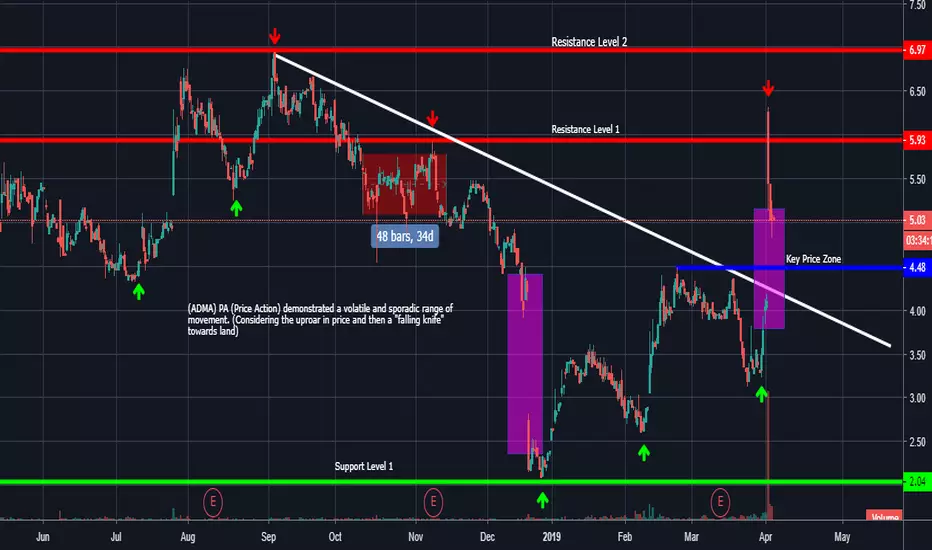
Volatile Past - 4hr Interval - ADMAHello Everyone,
The stock (ADMA) PA (Price Action) has been nothing but (IMO) an eye opener. As numerous traders were seeking to short the stock at price intervals (4.10 -4.15), there was another (bullish) penetration in the stock's trading average. This certainly is lesson for anyone interested or keen on investing in the stock market. (Avoid sporadic price fluctuations, be diligent and considerate of market catalysts)
Resistance Level 2 - (6.80 - 7.10) 30 cent interval
Resistance Level 1 - (5.80 - 6.10) 30 cent interval
Blue Horizontal Line (KPZ) - (4.30 - 4.55) 25 cent interval
Support Level 1 - (1.90 - 2.20) 30 cent interval
Furthermore, risk management is pivotal when attempting to trade such a stock. (Do not let impulsive actions wipe-out your account).
Not Investment Advice. For Educational and Analytical Purposes Only. (Be Conscientious and Stick To Your Plan)***
-LionGate

29/03/19 - ADMA (N) @ 3.68Overnight Hold - Broke day resistance after 2:30pm, Catalyst presented at conference on 19th March


ADMA - 40% potentialADMA is within a strong trend.
Price, MACD and RSI are all lined up for a new push up the channel.
Setting stop loss just below trend channel.

ADMA - Downward channel breakout long from $2.83/$3.21 to $4.43ADMA is running within a downward channel formation. It's getting some upward momemtnum & looking quite good. It seems trying to break out. It has lots of insider selling. We think it will be a good long trade.
* Trade Criteria *
Date First Found- December 26, 2017
Pattern/Why- Downward channel breakout
Entry Target Criteria- pullback to $2.83 or breakout above $3.21
Exit Target Criteria- 1st Target $4.43, 2nd Target Momentum
Stop Loss Criteria- $2.37
Indicator Notes- Twiggs money flow turned to the positive side
Special Note- Lots of insider buying
Please check back for Trade updates. (Note: Trade update is little delayed here.)

Long ADMA at 7.24, stop loss at 6.77Long ADMA at 7.24, stop loss at 6.77 and trailing stop loss on the way up in order to keep your profit.
