Aeva Technologies (AEVA) – Pioneering Next-Gen LiDAR Company Snapshot:
Aeva NASDAQ:AEVA is revolutionizing perception systems with 4D FMCW LiDAR—offering instant velocity detection, high precision, and long-range sensing, setting a new standard for autonomous systems.
Key Catalysts:
Breakthrough Technology
AEVA’s proprietary 4D Frequency Modulated Continuous Wave (FMCW) LiDAR provides real-time velocity and depth data, outperforming traditional Time-of-Flight systems in accuracy and safety.
Automotive OEM Traction 🚗
Strategic collaborations are translating into production-stage contracts, marking a key inflection from R&D to scalable revenue generation.
Multi-Sector Expansion 🌐
AEVA’s sensing tech is penetrating robotics, aerospace, and industrial automation, significantly broadening its TAM and diversifying revenue streams.
Government & Aerospace Validation
Recent contract wins with defense and aerospace clients underscore AEVA’s technological credibility and commercial viability.
Investment Outlook:
Bullish Entry Zone: Above $22.50–$23.00
Upside Target: $39.00–$40.00, supported by production scaling, cross-sector adoption, and deep-tech differentiation.
⚙️ AEVA stands at the forefront of smart sensing innovation with strong momentum into high-growth verticals.
#AEVA #LiDAR #AutonomousVehicles #Robotics #Aerospace #IndustrialTech #SensorRevolution #4DPerception #FMCW #TechStocks #Innovation #SmartMobility
AEVA trade ideas

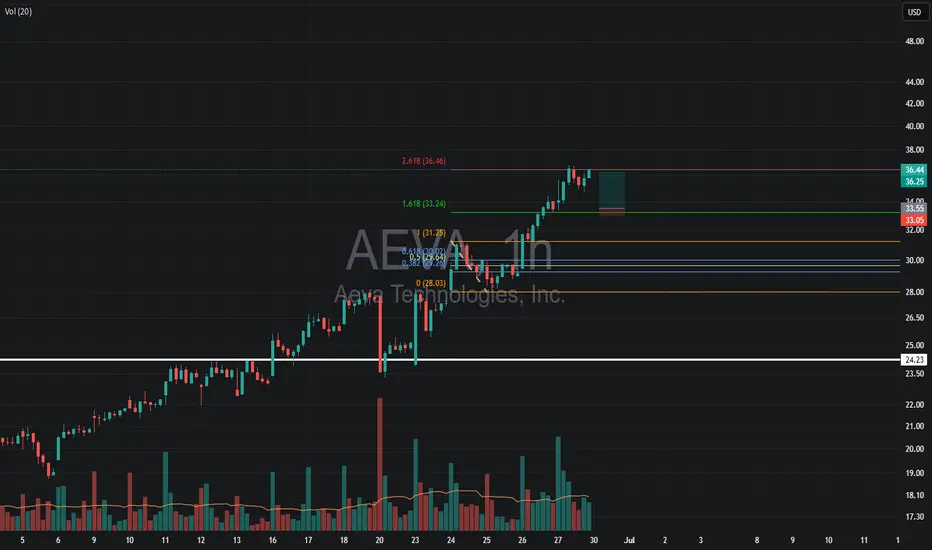
AEVA – Planning a Pullback Entry in a Strong UptrendWhy I Like This Setup:
Powerful daily uptrend — momentum clearly to the upside
Buyers stepping in on every dip — strong demand showing up consistently
Game Plan:
Entry Zone: Watching the 1.618 fib level for a pullback and bounce
Stop: Just below that 1.618 fib — clean invalidation point
Target: Previous high, but with this strength, I’ll likely use a trailing stop once price moves in my favor
Letting the trend do the heavy lifting on this one
Short Trade Setup – AEVA!📉
🔹 Asset: Aeva Technologies, Inc. (NASDAQ: AEVA)
🔹 Timeframe: 30-Minute Chart
🔹 Setup Type: Rising Wedge Breakdown
📌 Trade Plan (Short Position)
✅ Entry Zone: Below $9.19 (Breakdown Confirmation)
✅ Stop-Loss (SL): Above $9.72 (Wedge Invalidation Level)
🎯 Take Profit Targets
📌 TP1: $8.46 – Near-term Support Level
📌 TP2: $7.83 – Prior consolidation support
📊 Risk-Reward Calculation
📉 Risk: $9.72 - $9.19 = $0.53
📈 Reward to TP1: $9.19 - $8.46 = $0.73 → 1:1.38 R/R
📈 Reward to TP2: $9.19 - $7.83 = $1.36 → 1:2.56 R/R ✅
🔍 Technical Highlights
📌 Rising wedge pattern visible, now broken
📌 Breakdown occurred near psychological resistance ($10 zone)
📌 Retest rejected from breakdown zone (yellow level)
📌 Bearish divergence possible after extended rally
📉 Execution Strategy
📊 Wait for solid bearish candle under $9.19
📉 Trail SL to breakeven after TP1 hit
💰 Lock partial gains at TP1, let rest ride to TP2
🚨 Invalidation Risk
❌ Exit if price closes above $9.72
❌ Confirm breakdown with volume and price action
🚀 Final Take
✔ Rising wedge breakdown suggests bearish potential
✔ Attractive risk-reward profile
✔ Stick to the trade plan, manage emotions and risk

AEVA – 30-Min Bullish Setup!📈
🔹 Asset: AEVA Technologies
🔹 Timeframe: 30-Min
🔹 Setup Type: Ascending Triangle Breakout + Support Hold
🔸 Price at Breakout: ~$7.01
📊 Trade Plan (Long Position)
✅ Entry Zone: $7.00–$7.10 (breakout candle above trendline + yellow resistance zone)
✅ Stop Loss (SL): Below $6.34 (white horizontal support line)
✅ Take Profit Targets:
📌 TP1: $7.94 (red line – recent swing high/resistance)
📌 TP2: $9.12 (green line – next major resistance / measured move)
📐 Risk-Reward Ratio
📉 Risk per Share:
$7.00 - $6.34 = $0.66
📈 Reward to TP1:
$7.94 - $7.00 = $0.94 → 1.42:1 R/R
📈 Reward to TP2:
$9.12 - $7.00 = $2.12 → 3.21:1 R/R
🧠 Technical Confluence
📌 Ascending Trendline: Support from rising lows (pink line)
📌 Horizontal Resistance Break: $7.00–$7.10 breakout zone
📌 Volume Confirmation Needed: Ideally accompanied by increasing buy volume
📌 Strong Structure Below: Key bounce level at $6.34 acts as invalidation zone
⚙️ Trade Management Strategy
🔄 After TP1:
— Move SL to breakeven
— Book 50% profits
🎯 Let the rest ride to TP2
🔐 Trail SL below new support as it forms
⚠️ Invalidation
❌ Close below $6.34 support zone
❌ Weak volume on breakout or fakeout rejection
🦅 Final Notes
✔ Strong uptrend + clean breakout structure
✔ Great R/R setup with clear technical zones
✔ Smart entry above consolidation — watch price action closely!
