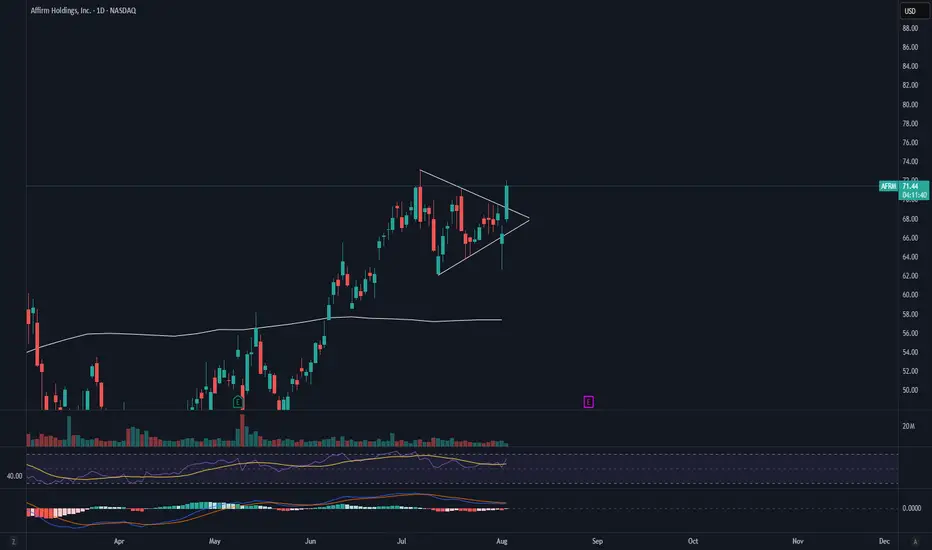
AFRM Pre Earnings Triangle BreakAFRM has broken the symmetrical triangle to the upside. If this holds we could see a strong rally into earnings. I would want to see strong volume added to this equation for the move up to be confirmed.
My STOP on this position would be a daily candle close back under the trendline with confirming volume. A retest of the triangle would be my spot to add to the position.
AFRM trade ideas
$AFRM - Stock forming a triangle pattern on the daily time frameAFRM - Stock forming an triangle pattern on the daily time frame. Possible breaking out on both side possible. looking for puts below $66.50 and calls above $69. on high watch here.

AFRM pre earnings triangleAFRM is currently in a symmetrical triangle with RSI and MACD beginning to show the pattern may come to an end. I would want to see this triangle break with volume before entering a long position.
AFRM eyes on $50.66: Semi-Major Genesis fib for High Support AFRM has been showing considerable strength.
Hit a Geneiss fib above and fell back to sister fib.
Strong Bull trend would hold this fib into new highs.
$50.66 is the immediate floor to hold
$49.17 is a minor fib for a speed brake.
$47.60 is Bulls' Last Stand to hold uptrend.
=============================================
.

AFFIRM - LONG POSITIONGood Morning,
Hope all is well. Good opportunity to snag a long on AFRM.
Enjoy!

This could be the beginning for affirmAffirm Holdings Inc. (AFRM) Bullish Analysis Report
Bullish Indicators for AFRM
1. Strong Q3 Performance:
- EPS: Reported $0.01 vs. a projected $0.09 loss, a $0.10 per share beat.
- Revenue: $783.14 million, up 36% YoY, driven by an 8.6 billion GMV (+36% YoY).
- Affirm Card Growth: 115% YoY growth in card adoption.
- 0% APR Loans: 44% YoY increase, showing a shift toward high-quality loan offerings.
2. Analyst Confidence:
-Susquehanna upgraded AFRM to 'Positive' with a $65 price target.
-Mizuho and J.P. Morgan maintained 'Outperform' and 'Overweight' ratings with targets of $70
3. Strategic Partnerships:
- Recently announced partnership with Costco, reasing transaction volume potential.
4. Technical Setup:
- Ascending Triangle Formation with clear resistance at $49.50.
- Watching for breakout confirmation on high volume.
- Volume spike suggests accumulation, not distribution. Trading Strategies
Entry Criteria:
- Enter above $49.50 with high volume confirmation.
- Alternatively, wait for a retest of $49.50 after the breakout.
Exit Criteria:
- Stop-loss at $48.50 if the breakout fails.
- Time stop: Exit by end of day if momentum fades.
Profit Targets:
- First Target: $51-$52
- Second Target: $55-$60
This could just be the beginning of a strong run-up if momentum holds and fundamentals remain strong

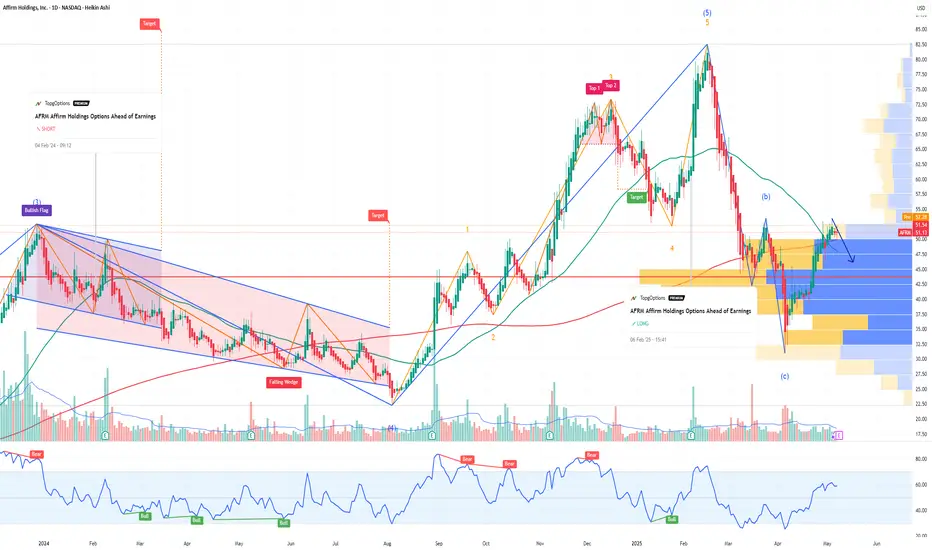
AFRM Affirm Holdings Options Ahead of EarningsIf you haven`t bought AFRM before the last rally:
Now analyzing the options chain and the chart patterns of AFRM Affirm Holdings prior to the earnings report this week,
I would consider purchasing the 50usd strike price Puts with
an expiration date of 2025-9-19,
for a premium of approximately $8.65.
If these options prove to be profitable prior to the earnings release, I would sell at least half of them.
AFRM eyes on $42.66: Golden Genesis fib, key barrier to recoveryAFRM is testing a Golden Genesis fib at $42.66.
Look for a Rejection or Break-and-Retest to buy.
There is open space for a pop to $47.60 or $49.17
.
Previous Analysis that caught a nice BREAK OUT
=============================================
.

$AFRM is retesting a textbook cup and handle pattern!This is a textbook cup and handle pattern if i ever saw one. It's retesting the neckline and nothing is stopping it from going to it's previous ATH in the future. Stoch rsi is oversold. nothing more to ad, it speaks for itself.

AFRM/USD – 30-Min Long Trade Setup!📌 🚀
🔹 Asset: AFRM (Affirm Holdings, Inc.)
🔹 Timeframe: 30-Min Chart
🔹 Setup Type: Bullish Breakout Trade
📌 Trade Plan (Long Position)
✅ Entry Zone: Above $50.13 (Breakout Confirmation)
✅ Stop-Loss (SL): Below $48.18 (Invalidation Level)
🎯 Take Profit Targets:
📌 TP1: $53.14 (First Resistance Level)
📌 TP2: $56.36 (Extended Bullish Move)
📊 Risk-Reward Ratio Calculation
📉 Risk (SL Distance):
$50.13 - $48.18 = $1.95 risk per share
📈 Reward to TP1:
$53.14 - $50.13 = $3.01 (1:1.54 R/R)
📈 Reward to TP2:
$56.36 - $50.13 = $6.23 (1:3.2 R/R)
🔍 Technical Analysis & Strategy
📌 Descending Trendline Breakout: The price is breaking out from a downtrend resistance, signaling a bullish reversal.
📌 Retest Confirmation: Price is hovering around $50.13, testing previous resistance as support.
📌 Strong Support at $48.18: This level has held multiple times, making it a key invalidation point.
📌 Volume Confirmation Needed: Look for high buying volume above $50.13 to confirm bullish strength.
📊 Key Support & Resistance Levels
🟢 $48.18 – Stop-Loss / Strong Support
🟡 $50.13 – Breakout Level / Long Entry
🔴 $53.14 – First Resistance / TP1
🟢 $56.36 – Final Target / TP2
📉 Trade Execution & Risk Management
📊 Volume Confirmation: Ensure high buying volume above $50.13 before entering.
📉 Trailing Stop Strategy: Move SL to entry ($50.13) after TP1 ($53.14) is hit.
💰 Partial Profit Booking Strategy
✔ Take 50% profits at $53.14, let the rest run toward $56.36.
✔ Adjust Stop-Loss to Break-even ($50.13) after TP1 is reached.
⚠️ Fake Breakout Risk
❌ If the price fails to hold above $50.13 and drops back below, exit early to avoid losses.
❌ Wait for a strong bullish candle close above $50.13 before entering aggressively.
🚀 Final Thoughts
✔ Bullish Setup – Breaking above $50.13 signals potential continuation.
✔ Momentum Shift Possible – Watch for volume confirmation.
✔ Favorable Risk-Reward Ratio – 1:1.54 to TP1, 1:3.2 to TP2.
💡 Stick to the plan, manage risk, and trade smart! 🚀📈
🔗 Hashtags for Social Media Posting
#StockMarket 📉 #TradingNews 📰 #StockAnalysis 📊 #MarketUpdate 🔥 #Investing 💰 #Trading 📈 #Finance 💵 #ProfittoPath 🚀 #SwingTrading 🔄 #DayTrading ⚡ #StockTrader 💸 #TechnicalAnalysis 📉 #MarketTrends 📊 #StockAlerts 🔔 #TradeSmart 🤓 #Bullish 🐂 #RiskManagement ⚠️ #TradingCommunity 🤝

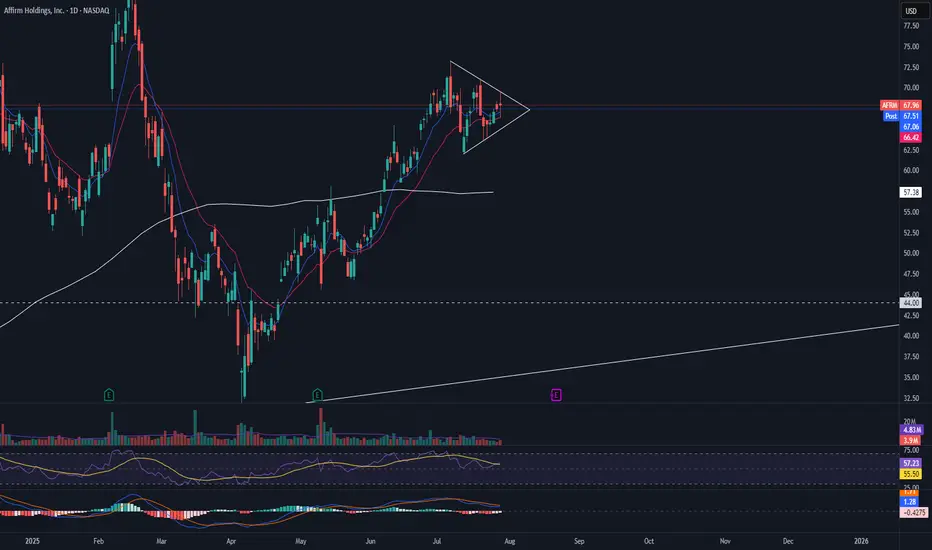
Bias remains bullish after price retest previous resistanceAFRM has seen strong momentum since I first shared this trade in November 2024. The price surged from $56 to over $80+ in February 2025 before retracing to test the resistance-turned-support level around $50.
📈 Our Bias Remains Bullish – We continue to buy into the uptrend, with key support levels based on the ascending trendline formed since May 2023:
🔹 Weak Support: $45
🔹 Stronger Support: $35
🔹 Major Support: $30
As long as these levels hold, AFRM remains positioned for further upside. 🚀

$AFRM $70-$80 target, cup and handle WEEKLY, pt. 2 chartYes, I used the brush and drew that juicy cup and handle. I don't know, friends, this one looks really good for setup to long. Part 1 was posted just before this give it a glance. The EMA and SMA used here was the 50 and in the previous chart was 200.
WSL

$AFRM $70 target into retest $80, pt. 1 chartI wish you could post multiple charts in the same size so you can see and I don't have to post twice. I looked at the D and W. This name should see it's IPO highs at some point this year, with the volatility it could be sooner than later as well. Resistance, in my opinion, looks to be $80 zone, a psyche area as well -- dating back to 3/2021, 1/2022, 2/2022, and 2/2025. Looks like $45-$50 which was once resistance now flipped to support. It touched the 200sma and riding the 200ema. & There almost seems like a huge cup and handle formed on the weekly as well... interesting. Also, look at the earnings on NASDAQ:AFRM ... lmao. Monstrous.
WSL

$AFRM - Will you bet?NASDAQ:AFRM Every time Affirm touch this level it bounce.
Are you willing to bet again?

Afrm idea we will see a bullish movement on afrm stock in the next few weeks due to its great revenue reported

Fundamental and Techincal support the moveI really like this opportunity, so I'm making a big move first thing Monday morning. The earnings are strong, and the stock has broken out of the accumulation phase with a big candle and high volume. I see potential for a continuation up to $150, but let's see how it plays out.

AFRM Affirm Holdings Options Ahead of EarningsIf you haven`t sold AFRM before the previous earnings:
Now analyzing the options chain and the chart patterns of AFRM Affirm Holdings prior to the earnings report this week,
I would consider purchasing the 75usd strike price Calls with
an expiration date of 2025-4-17,
for a premium of approximately $3.70.
If these options prove to be profitable prior to the earnings release, I would sell at least half of them.

Dragon pattern longHidden bullish divergence off support with a dragon pattern structure. Cut & dry with great R:R.

AFRM - channel breakout on dailyAFRM - Stock seeing channel breakout on daily as it approaches earnings to report next week. looking for breakout to continue as long as $62 holds. Calls above $62 for a move towards $70 and higher. Stock is strong on indicators

Target 58.4Following weekly chart
Got a short signal in my power indicator. Also there is a clear cup & handle formation which not break out yet.
TP 58.40 - Which intersect with fibonacci level and next support
SL 64.8 - Stop above candle close.

$AFRM - Watching to take a positionNASDAQ:AFRM hits the first target and has since pulled back. I am looking to re-enter around $50 to $48 area. 👀
As always, I share my opinions and trades. I'm not suggesting that anyone follow my trades. You do you.


Support found?Look like there might be support here. Look for bounce on higher volume. Watch out for trap on higher price but low volume.
