AKAM might soon end C WaveAKAM looks like it's close to finish the zig-zag pattern and could move to the downside although I would wait to see if price can manage to break and consolidate below 94$ until that to happen a move to the upside can't be ruled out.
AKAM trade ideas

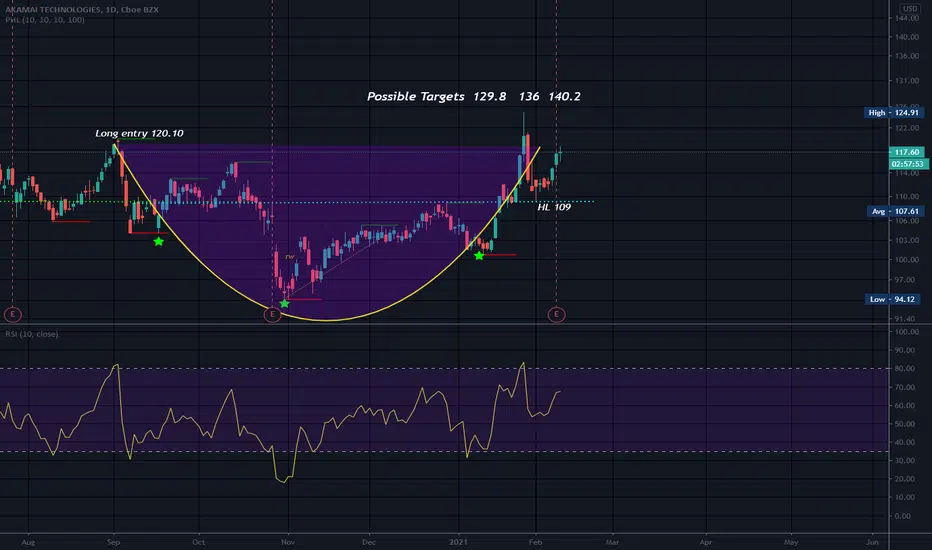
LONG AKAM BIG+% returnsAKAM at trend good company positive momentum trend bounce and all that good company

ABC BullishPossible stop below C. Earnings 11-2 after market close.
I have looked at this stock on several occasions over the last few years. It does seem to struggle, yet they they have not missed earnings in eons. Short interest is a bit over 6% but is always higher than I would think it would be for AKAM. I looked back over many years and at one time the high was 345.5. This was many, many years ago though and perhaps this is a mountain stock like CIEN which had a high of over a thousand dollars many years ago. Perhaps they were arcs back then, probably so. I like to look back the maximum monthly on stocks so I saw this. It can take many years, if ever, to top a mountain a stock formed so long ago.
A price mountain is just like it sounds. Price forms a high peak and then reverses and looks like a mountain, or a tall peak, on a long term chart (often on a shorter term chart too if you catch a look when the mountain forms). Thing is, these reverse sharply and can take many years to recover. But this is like 20 years later! Folks were certainly bullish ok AKAM in 1999!
Revenue growing year on year and AKAM is in to cybersecurity among other entities. PE 19.36 and EPS is 5.61.
Doji today which represents indecision.
Negative volume is high on AKAM showing smart money interest.
No recommendation.
Akamai Technologies, Inc. provides cloud services for securing, delivering, and optimizing content and business applications over the internet in the United States and internationally. The company offers cloud and enterprise security solutions to keep infrastructure, websites, applications, application programming interfaces, and users safe from various cyberattacks and online threats while enhancing performance. It also provides web and mobile performance solutions to enable dynamic websites and applications; media delivery solutions, including video streaming and video player services, game and software delivery, broadcast operations, authoritative domain name system, resolution, and data and analytics; and edge compute solutions to enable developers to deploy and distribute code at the edge. In addition, the company offers carrier offerings, including cyberthreat protection, parental controls, DNS infrastructure and content delivery solutions; and an array of service and support to assist customers with integrating, configuring, optimizing, and managing its offerings. It sells its solutions through direct sales and service organizations, as well as through various channel partners. Akamai Technologies, Inc. has a strategic partnership with Queue-It to deliver a cure for Covid vaccine registration. The company was founded in 1998 and is headquartered in Cambridge, Massachusetts.

Potential 2Down 2Up Weekly Reversal For AKAM Potential 2Down 2Up Weekly Reversal For AKAM : Per the Strat, this week I'm watching ticker AKAM (Akami Technologies Inc) for a weekly entry trigger at 110.31 (last weeks high). If that trigger is met, I'll look for it to reach a magnitude of 112.67 (week before last weeks high). If it can reach magnitude, then it could also continue up to previous highs. Just look out for a reversal right at or after the original 112.67 magnitude.

$AKAM Consider selling puts or buying Aug calls on this stock.Stock held really well even on a bad day which shows strength. So with any rebound on the Nasdaq this will probably run higher.
Stop will be right below 50day moving average.

AKAM: Breakout Confirmed, 9.21% Potential Profit!Description: AKAM is trending higher and in an uptrend meaning that highs are getting higher and lows are getting higher. The uptrend line on the chart and the Trending Band Indicator (which measures trend) supports the Long Position.
Stats:
1. Ideal buy range: $109.8 - $113.1
2. Take profit: $121.17
3. Stop Loss: $107.62
4. Risk To Reward: 1 / 3
5. Accuracy Rating: 93%

AKAM🌦 update Fractal on the 5 min. Several stocks seem to be looking to head up higher. What can I say sometimes the stars align. The more fractals I see the more convinced I become that the overall market is heading up.

AKAM🌦Pattern recognized: Irregular flat Elliot Correction Wave.
Thesis: Bullish sentiment.
Conclusions: LDC on the lower time frame. Entry for calls.
***This does not constitute financial advice.***

AKAM Long Term BuyAKAM is one of the few companies in its sector that is consistently profitable. It is trading 25% below its ATH and at a modest 29 P/E compared to its 5y Avg of 34 P/E. While its P/B is currently at 4 compared to its 5y Avg of 3.6, it is still at a discount for a solid company. Its earnings are expected to grow by 10% over the next year and considering it is trading below its average fair price, we can see at least a 15-25% growth.
Target Accumulation Range: $92.25-$94.5

Waiting for price to hit my level!no confirmation = no trade
no profit margin = no trade
must get a confirmation on LTF
Either 15M Timeframe or 10M or 5M
we must get a change of trend on those timeframes like price coming into the zone with LL/LH and we need HH/HL To come in!
that's how i enter 99% of my trades

Cup and Handle Earnings 2-9 AMCEarnings today AMC..
Mid cup is 107.05 which is close to handle low.
Long term high 345.5 3 year high 124.91
Not a recommendation

Inverse Head and SouldersHas just broken neckline, but a confirmed uptrend is not in place..
Head - 94.12
LS - 100.7
RS - 100.70
It is preferrable to some to have the RS higher than the LS. Some say it makes no difference.
NV and OBV are high. AKAM fell from a bearish rising wedge and appears to have recovered. I was watching down there..lol..just waiting on it to fall out far enough to feel safe getting in..
Short interest is a bit over 6% depending on where you look..which is a little higher than I would have thought. When it was in the wedge, I am not surprise it was high as shorties love to short rising wedges. Anyway, just something to be aware of..
Targets 2 are long term targets and as a rule they occur after a pull back has occurred..
Not a recommendation

S Triangle Earnings 2-9 AMCAlso very close to a Bullish Butterfly Pattern..
AKAM was tangled up in a rising wedge during it's stay in the symmetrical triangle. It has fallen from the bearish rising wedge and seems to have recovered. Broke up from the S Triangle pattern. A S Triangle can break either way and is usually a continuation pattern and a period of consolidation.
Earnings are soon and it does not look like they miss much/short is a bit over 6%
The butterfly pattern adheres to FIB levels and this one is slightly shy on B reaching the 0.786 and D reaching the 1.27 mark of the XA leg. Hence, I did not post targets for this pattern.
Most harmonic patterns have an ABCD pattern inside of it.
There is also a bad looking top before the pullback and appears to be a H&S top with C being the RS..
Not a recommendation


AKAM watch for entry. entry at the 200 SMA has divergence on the daily and Hidden bullish on the weekly. 3 to 1 on the 886 and 5 to 1 on the 100 measured move.


Bear Flag Rising Wedge Pull Back FishingDespite the bear Flag and rising wedge, I am still watching this one. AKAM broke bottom trendline of rising wedge today. Rising wedges are bearish as a rule and are not valid until bottom trendline is broken. There is a lack of healthy pull backs, with missing touches to bottom trendline, and it interrupts supply and demand. I do not buy a stock inside of a rising narrowing wedge. After it falls out, I wait a while to see how far it will fall. When the 5 day MA crosses up and through the 20 MA, or gets close, I buy if interested.
AKAM also broke through bottom of bollinger bands using a 80 day moving average. This represents extreme selling pressure, but I find it bullish at times due to a lot of the sellers are gone..leaving stock free to rise when the time is right. The time does not feel right..yet )o:
Unfortunately, quite a few others were thinking the same thing and too many folks bought this too fast causing a bearish rising wedge.
Anyway, still watching but too many bears hunting this one right now. It will return/strong stock
Just an observation
I have often wondering why some stocks get stuck in these patterns and another does not. Obviously there are some issues but I have not researched the fundamentals for any changes yet.

Pullback FishingI set the bollinger bands on a 3 standard deviation with a 80 SMA ..if price falls out of this then as a rule, selling pressure is very strong.
Unfortunately AKAM got off the bottom and ended up in a small rising narrowing wedge..if and when it breaks bottom trendline of that RW, I will go long.
Possible Head and shoulders top..
Supply and demand are what makes the market go round (o: A Chart is a mere Xray of supply and demand . Possible head and shoulders top.
Large players are buying this as noted on effective volume . It does not mean it will not go lower. They are investing other folk's money and not their own as a rule...not always but a lot of the time. They are willing to buy at a higher level than most of us are. As long as price goes up in the next eon, they are happy (o:
I have found just because there is accumulation, it is not always at the best price.
The 5 sma has not crossed up and through the 20 sma . Infact it is almost opposite so perhaps not time yet to buy. Some folks buy when the 5 crosses up and through the 20 and sell when the 5 crosses down through the 20. We all have the moving averages that crank our tractor (o:
Price just crossed the 50 sma today..the 50 crossed down through the 100 ma a few weeks ago and both of those moving averages are tilting down. They are both still over a 200 day moving average that is still tilting up, despite it all. The 200 is the longest I use.


Supports and resistance explainedHere , in this chart, we have a good example of how the prices are being cushioned at the support level (94.71) with previous records in May 2020. The prices are now being hindered by a upper ceiling , called the resistance at 103.50.
So, we can say prices are in a sideway move or range bound for now. This will go on for a while until one side gives way. That is either it breaks out of the resistance level or breaks down of the support level.
If it is the latter, do you then short it ? I won't since this stock is on an bullish trend. I would monitor its share price if I am keen to long it later. The next support would be 83-88 level.
However, if it does break out of the resistance with bullish signals, then it is a buy as I expect the prices to go up higher towards 116 and beyond.
That is for the chart thus far! But if you look at the fundamentals side, you might want to consider sector rotation since Tech stocks now are coming down a bit and value stocks are being favoured by investors. That is not to say Tech stocks will plunge but in the short term, it is likely to correct itself (which is a good thing if you want to accumulate more shares).
An important aspect of support and resistance is it is to be taken as a GUIDE and not a MUST OBEY rule. That means, prices being supported at a certain level can be temporary or even a false one to trap buyers only to fall through later. Or a fake breakout of a resistance level only to tumble down later as well. Such tricks are common in the market place and one needs to be cautious in execution.
Have I suffered such fate before ? Aplenty !!! The consolation is this temporary losses are compensated by my long term investment outlook so I would not take this paper losses too hard , knowing it will rebound sooner or later .Example, Tencent, Meituan, Xiaomi, Haier, etc.
In short term trading, one need to be mindful of your STOP LOSS cos that is what is going to protect your capital. And it is ALRIGHT to be wrong in some trades even your analysis may be right. Getting too fixated why the market plays you out instead of going along with your plans is tantamount to analysis paralysis. In my opinion, take the losses and quickly move on as there are abundant trade opportunities out there.
Every trader has his or her own trading style and some like to do post mortem analysis , spending hours , weeks to fact find what went WRONG ! I am not so technical nor obsessed to this stage. Sometimes, my mistakes are greed or plain silly like hitting the sell button instead of buy or typing the wrong position size ,etc. Chart wise , I am pretty consistent as I used the same trend lines, supports and resistance, price action patterns ,etc to facilitate my trades.
I hope this write up is useful and I welcome any comments you may have. If you like my train of thoughts, follow me , give me a thumbs up or CHEERS, that would be very much appreciated. Cheers.


