ALAB Earnings Play: High-Conviction Call Option Setup!
## 🚀 ALAB Earnings Play: High-Conviction Call Option Setup!
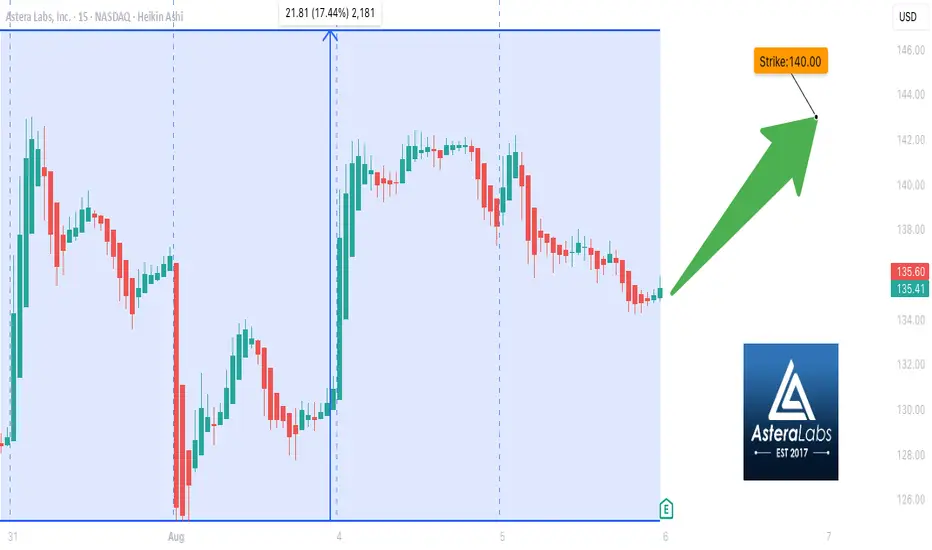
**Astera Labs (ALAB)** reports **Friday BMO (Aug 8)** – eyes on breakout potential.
---
### ⚡️ Bullish Thesis:
* 📈 **TTM Revenue Growth:** +144.3%
* 💰 **Gross Margin:** 75.8%
* 🧠 **AI + Cloud Tailwinds** fueling semiconductor strength
* 💥 **Beat Rate:** 5/5 last quarters | Avg surprise: +137.5%
* 📊 **Bullish Options Flow:** Heavy call interest @ \$140 & \$145
* 🔥 **Momentum:** Trading near ATH, outperforming sector
---
### 📉 Weak Spots to Watch:
* ⚠️ EPS Growth expected to dip -12.2%
* ⚖️ Negative EBITDA margin (-3.7%) suggests cost pressure
* 📉 Light volume into earnings could slow post-report follow-through
---
### 💡 Trade Idea:
**🎯 ALAB \$140 CALL**
* 💵 Entry Price: \$7.00
* 📆 Expiry: Aug 8, 2025
* 🎯 Profit Target: \$21.00 (200%)
* 🛑 Stop Loss: \$3.50
* 🕒 Entry: Pre-earnings close (Aug 7)
---
### 🔍 Risk-Reward Snapshot:
* ✅ Favorable macro + sector context
* ✅ 3:1+ reward ratio
* 🚨 Watch \$134.00 support zone
* ⏱ Exit within 2 hours post-earnings if no move
---
**📈 Bullish Confidence: 75%**
Breakout traders are watching \$142.23 — a blowout print could push it toward \$150+.
ALAB trade ideas
ALAB $304 After Consolidation Around $180 Resistance/SupportALAB had a big rise today into $180 resistance. This should be an area where a small pullback occurs or a further rise and then pullback into what will be $180 support. (Personally I'm leaning towards pullback above $180 rather than below)
Keep an eye on the major trendline as if ALAB gets too far away it will eventually want back to that trendline.
$304 is the next target. All Information Technology / Computer stocks are in the middle of the a big uptrend so this one has room to run.

ALAB WEEKLY TRADE IDEA (2025-07-31)
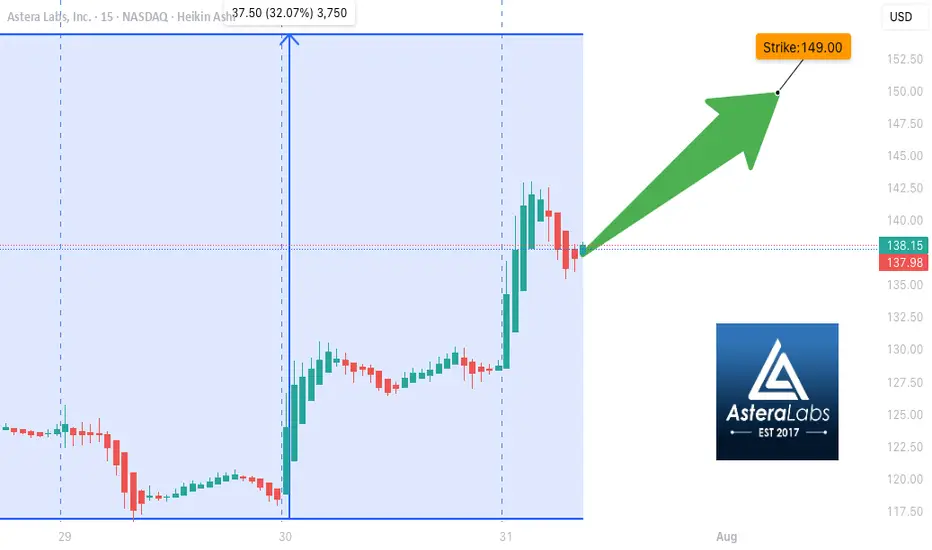
### 🚨 ALAB WEEKLY TRADE IDEA (2025-07-31)
🧠 **Smart Money Snapshot**
→ RSI: **76+** = Strong Momentum
→ Call/Put Ratio: **2.19** = Bullish Bias
→ Volume: 📉 **0.6x last week** = Momentum may fade
→ Gamma Risk: ⚠️ High = Expect **fireworks**
---
📈 **TRADE SETUP**
💥 Ticker: **\ NASDAQ:ALAB **
🟢 Strategy: **Buy Call**
🎯 Strike: **\$149.00**
💰 Entry: **\$0.65**
🎯 Target: **\$0.97** (50%+)
🛑 Stop: **\$0.39**
📆 Expiry: **Aug 1 (1DTE)**
📊 Confidence: **75%**
---
⚠️ **Risk Note:**
1DTE = 💣 High gamma = **big reward / big risk**
🧯 Size small. Exit fast. Ride momentum.
---
📌 Trade posted: **2025-07-31 @ 10:58 AM ET**
\#ALAB #OptionsTrading #WeeklyPlay #GammaSqueeze #MomentumTrade #TradingViewViral
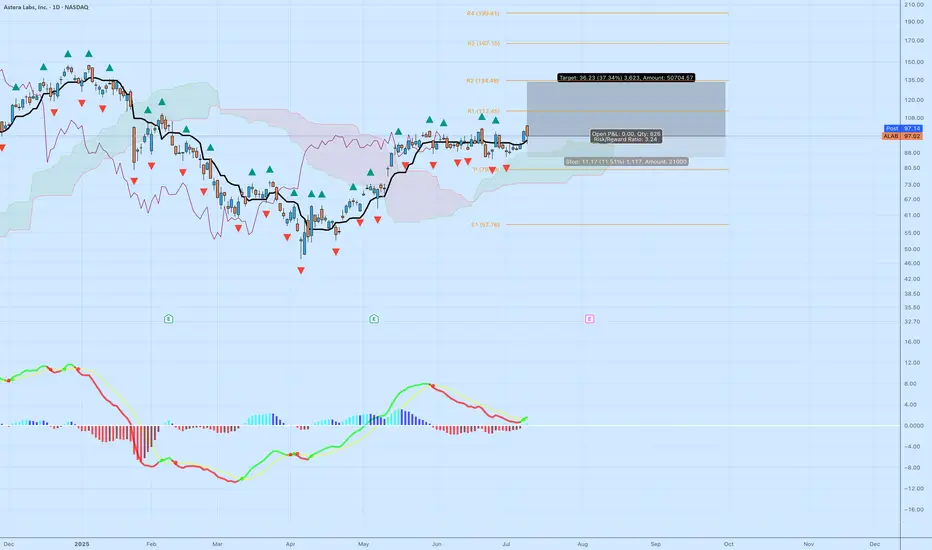
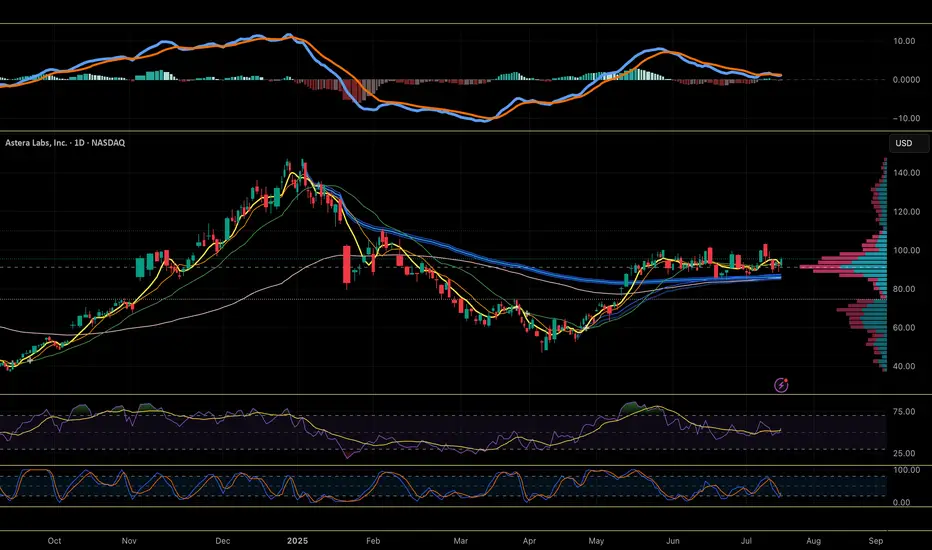
ALAB: High-Quality Breakout With Strong Structure and 3.2 R/RAstera Labs ( NASDAQ:ALAB ) just delivered a clean technical breakout above multi-week resistance, paired with bullish confirmation from momentum and Ichimoku structure. This isn’t a hype trade — this is what a textbook continuation breakout looks like.
📊 Key Technical Breakdown
Base Breakout
After weeks of tight consolidation, NASDAQ:ALAB just broke above horizontal resistance at ~$95. The breakout candle is strong, with above-average range and a decisive close.
Ichimoku Cloud
Price is well above the cloud — this confirms bullish trend.
The Kijun (black line) is sloping upward, and the cloud is thick and rising.
Pullbacks toward $88–90 could act as support if the breakout retests.
MACD Reversal
The MACD has flipped green, signaling a momentum shift.
Histogram is expanding upward again, showing renewed buying pressure.
This is happening as price reclaims the top of the recent range — a great alignment.
🎯 Trade Specs
Entry: $97.02
Target: $133.25 (+37.34%)
Stop: $85.32 (–11.51%)
Risk/Reward: 3.24 — solid skew for a growth name
Context: Strong prior trend, healthy consolidation, and now continuation. This isn’t a bottom-pick — it’s trend-following at a breakout moment.
🧠 Why This Trade Works
Structure: You’re not chasing green candles. This breakout comes after a long base and clears prior congestion.
Asymmetry: A 3.2+ R/R setup means you can be wrong more than half the time and still come out ahead — if you stick to your stops.
Momentum Alignment: Momentum and price are moving together — never fade a breakout with confirmation from both price action and indicators.
📌 Tip for Readers:
If you’re new to swing trading, study how this base formed and what conditions led to the breakout. The goal isn’t prediction — it’s positioning at the right moments with risk defined.
Will ALAB Finallyt Breakout?NASDAQ:ALAB has had several breakout attempts to no avail? Is now the time? Keep an eye on it, on the verge up starting an uptrend.... I hope I did not jinx it.
$ALAB Forming a Megaphone PatternNASDAQ:ALAB has seen a lot of volatility as of late. I took a position in it and was stopped out for a loss due to that volatility.
I may be too fixated on this name, but I want to get involved as I think it has a chance to run to previous highs. I thought it had formed a cup with handle pattern, and I got involved on Wed. June 18th only to get stopped on Monday, Jun 23rd. I have been watching it since.
Now it appears it is forming a megaphone pattern. These patterns usually resolve in the direction of the last trend. In this case that trend was up. I like too that the 50 DMA (red) is in an uptrend. I have an alert set on the upper trendline resistance area. Should that trigger, I will look for a good risk reward entry.
If you like this idea, please make it your own and follow your trading plan. Remember, it is your money at risk.
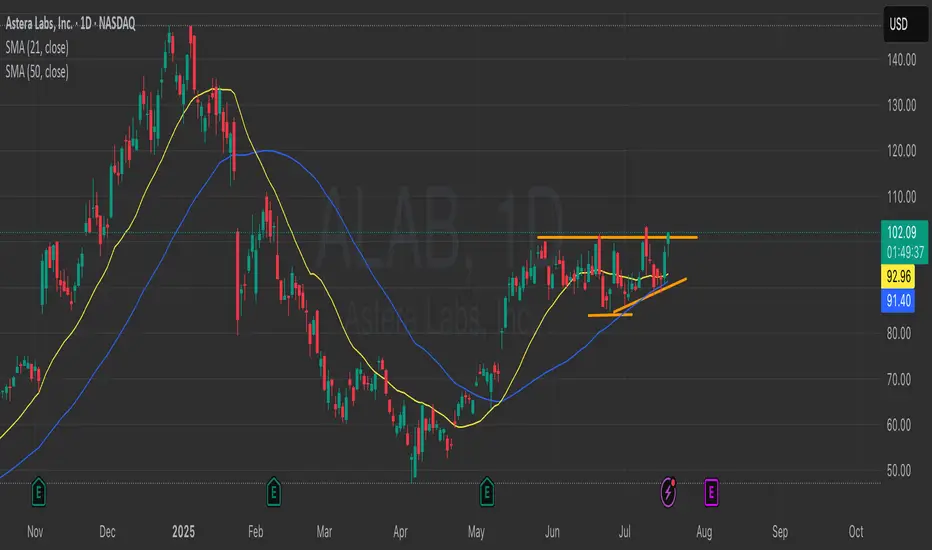
$ALAB coiled over AVWAP pinchNASDAQ:ALAB has been coiling in a tight range since May, when it vaulted over the AVWAP from the January high. Now above the AVWAP pinch from that Jan high and April low, consolidating above key moving averages, the stock looks ready to launch soon of the volume shelf at ~$90-92
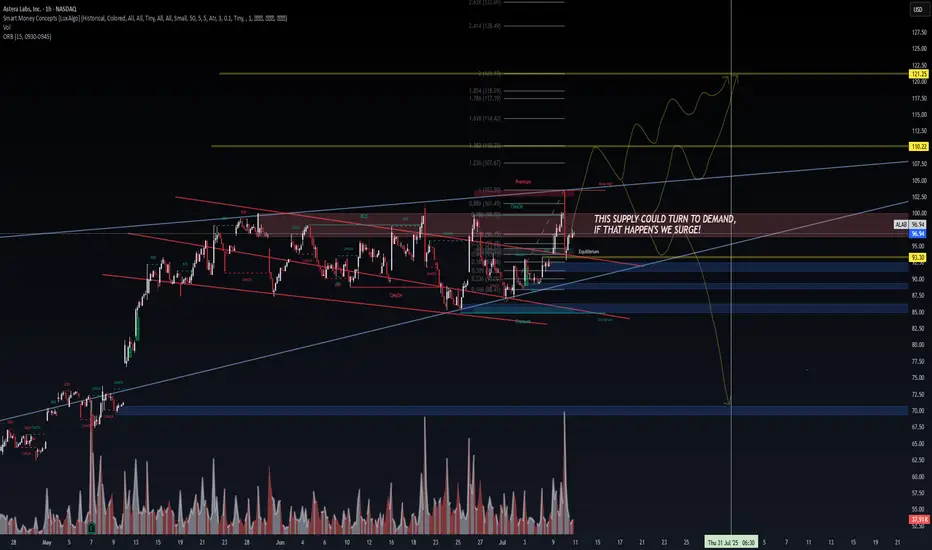
ALAB | Smart Money Compression → Breakout Threat🔭 ALAB | Smart Money Compression → Breakout Threat
Posted by: VolanX Quant Systems | July 10, 2025
We're at a critical inflection point on $ALAB.
The previous supply zone (highlighted in red) is under pressure — one more CHoCH + BOS and it may flip to DEMAND. If that happens, we don’t trickle...
We surge.
🧠 VolanX DSS Notes:
SMC Structure: Multiple CHoCHs + recent BOS confirm internal strength
Volume spike confirms interest at this price level
0.886 Fib rejection zone tagged @ ~$101.49
Equilibrium sits near $95 — ideal backtest zone
Bullish path = target range $110.22 → $122.50
Bearish scenario only resumes below $93.30, where supply holds and volume fades
“This supply could turn to demand — if that happens, we surge!”
🛠️ Risk Layering:
Entry: $96.50–$97.00
Risk: Close below $93.30 invalidates thesis
Reward: Multi-leg rally toward golden pocket + extended fibs
📉 If demand fails to hold, expect retracement into deep discount zones between $72–$77.
🧬 LSTM-backed directional bias: UP (70% confidence)
📊 Options flow is light but positive risk sentiment observed
#SmartMoneyConcepts #ALAB #VolanX #OrderBlock #CHoCH #BreakOfStructure #QuantTrading #SupplyDemand #FibonacciLevels #LSTM #LiquidityZones #WaveAnalysis #TradingView #InstitutionalFlow #DSS
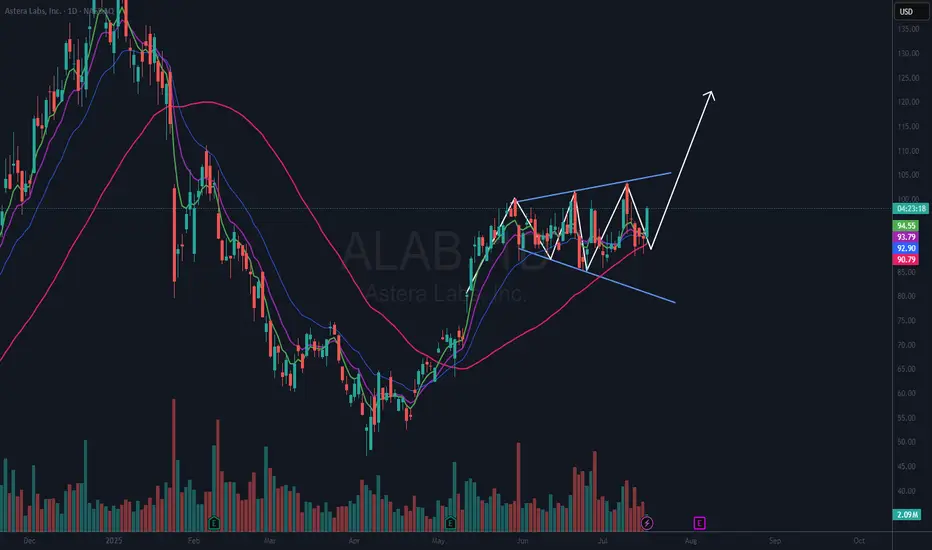
Astera labs breaking outNASDAQ:ALAB is breaking out today out of this symmetric triangle, could be a big mover...
Semi sector has been strong and ALAB has been lagging quite a bit, let it catch up

ALAB Off to the racesGreat to finally see ALAB start to kick in. After a few down days, it is starting to participate in the SEMI bull run.

Is ALAB starting to show some life?ALAB has had a terrible few days... mahy be starting to perk up... bright future

ALAB - EASY SHOT UPGood Morning,
Hope all is well. As you can see ALAB has built some momentum on the news of strategic partnerships for AI technologies with NVIDIA. The next resistance is easily broken, with this momentum there is no reason for ALAB to not hit above 140$.
ENJOY!

Astera Labs at SupportAstera, one of the strongest growth stocks right now is holding support looking to return back to resistance and above.
Good luck!

ALAB held so Strong through pullback in market. NASDAQ:ALAB held really strong through this downturn in markets and now breaking above 20Dma again. could double in next 1 year.

Time for manufacturing companies to get paidmanufacturing companies for semi conductors showed a while ago that the direction of semi chip stocks was headed south.
Now, I see a great long term set up for the companies that actually make the parts. After these pop off with IWM soon, then mega cap stocks will see a push up.
Target 1 is $50
Target 2 is $55
May see a pull back right after this and then the rally

Short it!Price closed at 86.45 on Friday below 34-50 EMA. Support can be found at 77.79. Phase oscillator in distribution. Short spread can be used to catch follow knife. Exit at 50% profit of debit spread of monthly spread. I would choose December monthly expiration. Good luck!

ALAB: downward regressionAstera Labs has been trading in a downward regression channel. Due to post IPO volatility it is a regression with either two standard deviations (inner green channel), or three standard deviations (outer blue channel). Most of the time the sock popped to the upper bound of two sigma channel (marked ‘2’) it then returned to the regression mean, and retraced roughly at fibo .786, 1.618. 1.618 to support line of the two sigma channel. In August with increased volatility it’s trading within three standard deviations (marked ‘3’). There is a Bearish engulfing candle today and if the regression holds, short-term it has to return at least to the mean regression i.e. the mean around 36 and it may retrace more to the support of the two sigma line at least. For the time being, I would avoid buying, or will sell short and watch for fibo support levels at .786 to 1.618 of the last impulse wave.
There is no big use in oscillators, short-lived price history, just looking at stochastic with fast settings 14, 1 (blue line) to be oversold close to zero to look for a support level.
!NOT A FINANCIAL ADVICE, short trading is connected with higher risk. Always put a stop on short positions

ALAB - Breakout imminent?Have a feeling we'll have an upside breakout from this wedge.
Keep your eyes peeled. Breakout will determine direction.
Not financial advice.

Pull back to $61 before ascend?Looks like we had a bearish breakout below the wedge. Can see this pulling back to the .236 fibonacci. Short profit target $61.50.
*DISCLAIMER* I will say this is possibly a high risk play as it looks like price action is pinned at the .382 which can also be a reversal point like the .236. That being said, if you are long this is not a bad place to DCA but I would save most of your cash for the $61 entry.
Once this target is reached I anticipate a reversal to the upside.
Long Entry: $61-$62.
Not financial advice. Use a stoploss please.
