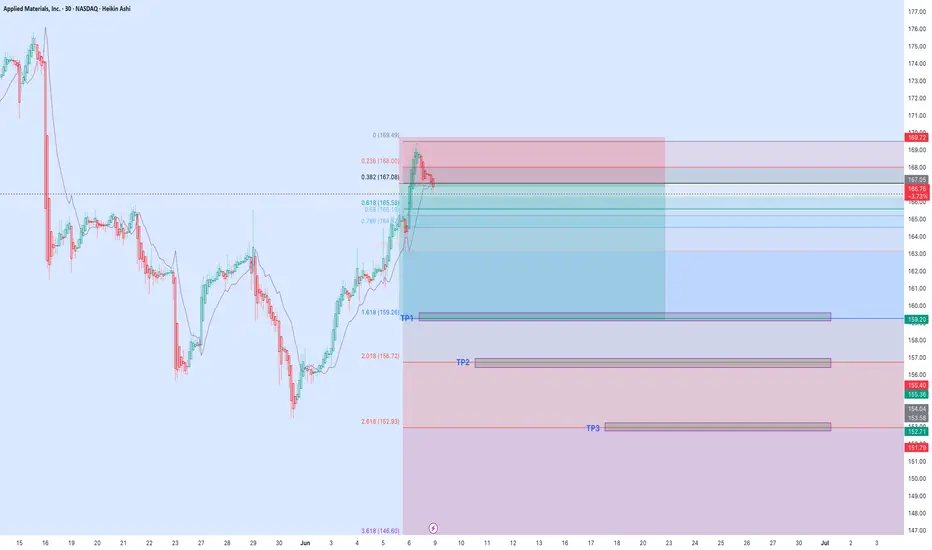
Applied Materials | AMAT | Long at $169.75Republican Ashley Moody recently dropped $200k-$500k on Applied Materials $NASDAQ:AMAT. The semiconductor boom may not be over...
Price-to-earnings: 21.68x (great in comparison to others...)
Debt-to-equity: 0.34x (low)
Cash flow: $10.4 billion (FY2024)
Insiders awarded options recently
Unless NAS
Next report date
—
Report period
—
EPS estimate
—
Revenue estimate
—
8.27 USD
7.18 B USD
27.18 B USD
800.39 M
About Applied Materials, Inc.
Sector
Industry
CEO
Gary E. Dickerson
Website
Headquarters
Santa Clara
Founded
1967
FIGI
BBG000BBPFB9
Applied Materials, Inc. provides manufacturing equipment, services and software to the semiconductor, display and related industries. It operates through the following segments: Semiconductor Systems, Applied Global Services, and Display & Adjacent Markets. The Semiconductor Systems segment includes semiconductor capital equipment for etch, rapid thermal processing, deposition, chemical mechanical planarization, metrology and inspection, wafer packaging, and ion implantation. The Applied Global Services segment provides solutions to optimize equipment, performance, and productivity. The Display & Adjacent Markets segment offers products for manufacturing liquid crystal displays, organic light-emitting diodes, equipment upgrades, and other display technologies for TVs, monitors, laptops, personal computers, smart phones, and other consumer-oriented devices. The company was founded on November 10, 1967 and is headquartered in Santa Clara, CA.
Related stocks

$AMAT, Long, TP>10-15%NASDAQ:AMAT , Long, TP>10-15%
Fundamentally the stock is good.
Choose an entry point and do not forget about a protective order if you are trading with leverage.
Don't risk it if you're not sure.
Good luck to everyone.

AMAT on WatchLooking for a break above $176.50 and retest before entering.
Why:
Broke out of long term channel
Made a strong recovery after shakeout on May 30th
Above all major EMAs on daily and weekly


Correction or continuation of short trendAMAT and other AI stocks made a jump at the end of last week .
This big jump to me was to liquidate the short order and now the wave came to an end with a rejection on 0.236.
Never forget SL
Trade Safe

Quick View: $AMAT
Daily -> Pullback with Bullish EMAs
Hourly-> Still bearish with slow pullback
Watching for a #TopSwing Setup on the Daily Chart
Area of $166 as key resistance.
Support → $153

$AMAT BUY BABY BUY AI BOOM NASDAQ:AMAT – The Pick & Shovel AI Play Nobody’s Talking About
📈 In this video, I break down why Applied Materials ( NASDAQ:AMAT ) is one of the smartest plays in the AI infrastructure race — and why hedge funds are quietly building positions while everyone else chases hype.
🔍 Key Takeaways:
NA

Applied Materials Stock Chart Fibonacci Analysis 050925Trading Idea
1) Find a FIBO slingshot
2) Check FIBO 61.80% level
3) Entry Point > 148/61.80%
Chart time frame: D
A) 15 min(1W-3M)
B) 1 hr(3M-6M)
C) 4 hr(6M-1year)
D) 1 day(1-3years)
Stock progress: A
A) Keep rising over 61.80% resistance
B) 61.80% resistance
C) 61.80% support
D) Hit the bottom

AMAT watch $159.46 above 154.74 below: Golden Fibs to BreakAMAT moving somewhat independent of the market.
Currently osculating between two major Golden Fibs.
Golden Genesis at $159.46, Golden Covid at $154.74

See all ideas
Summarizing what the indicators are suggesting.
Neutral
SellBuy
Strong sellStrong buy
Strong sellSellNeutralBuyStrong buy
Neutral
SellBuy
Strong sellStrong buy
Strong sellSellNeutralBuyStrong buy
Neutral
SellBuy
Strong sellStrong buy
Strong sellSellNeutralBuyStrong buy
An aggregate view of professional's ratings.
Neutral
SellBuy
Strong sellStrong buy
Strong sellSellNeutralBuyStrong buy
Neutral
SellBuy
Strong sellStrong buy
Strong sellSellNeutralBuyStrong buy
Neutral
SellBuy
Strong sellStrong buy
Strong sellSellNeutralBuyStrong buy
Displays a symbol's price movements over previous years to identify recurring trends.
AMAT4993873
Applied Materials, Inc. 2.75% 01-JUN-2050Yield to maturity
6.85%
Maturity date
Jun 1, 2050
AP2A
APPLIED MATERIALS 17/47Yield to maturity
5.95%
Maturity date
Apr 1, 2047
AMAT.GH
Applied Materials, Inc. 5.85% 15-JUN-2041Yield to maturity
5.24%
Maturity date
Jun 15, 2041
US38222AJ4
APPLIED MATERIALS 15/25Yield to maturity
4.98%
Maturity date
Oct 1, 2025
US38222AK1
APPLIED MATERIALS 15/35Yield to maturity
4.79%
Maturity date
Oct 1, 2035
AMAT4993872
Applied Materials, Inc. 1.75% 01-JUN-2030Yield to maturity
4.58%
Maturity date
Jun 1, 2030
US38222AL9
APPLIED MATERIALS 17/27Yield to maturity
4.25%
Maturity date
Apr 1, 2027
AMAT5827120
Applied Materials, Inc. 4.8% 15-JUN-2029Yield to maturity
4.21%
Maturity date
Jun 15, 2029
See all AMAT bonds
Curated watchlists where AMAT is featured.


Frequently Asked Questions
The current price of AMAT is 185.69 USD — it has decreased by −1.29% in the past 24 hours. Watch Applied Materials, Inc. stock price performance more closely on the chart.
Depending on the exchange, the stock ticker may vary. For instance, on NASDAQ exchange Applied Materials, Inc. stocks are traded under the ticker AMAT.
AMAT stock has fallen by −3.82% compared to the previous week, the month change is a 2.53% rise, over the last year Applied Materials, Inc. has showed a −10.36% decrease.
We've gathered analysts' opinions on Applied Materials, Inc. future price: according to them, AMAT price has a max estimate of 250.00 USD and a min estimate of 160.00 USD. Watch AMAT chart and read a more detailed Applied Materials, Inc. stock forecast: see what analysts think of Applied Materials, Inc. and suggest that you do with its stocks.
AMAT reached its all-time high on Jul 10, 2024 with the price of 255.89 USD, and its all-time low was 0.01 USD and was reached on Dec 18, 1974. View more price dynamics on AMAT chart.
See other stocks reaching their highest and lowest prices.
See other stocks reaching their highest and lowest prices.
AMAT stock is 2.18% volatile and has beta coefficient of 1.70. Track Applied Materials, Inc. stock price on the chart and check out the list of the most volatile stocks — is Applied Materials, Inc. there?
Today Applied Materials, Inc. has the market capitalization of 149.02 B, it has decreased by −1.63% over the last week.
Yes, you can track Applied Materials, Inc. financials in yearly and quarterly reports right on TradingView.
Applied Materials, Inc. is going to release the next earnings report on Aug 14, 2025. Keep track of upcoming events with our Earnings Calendar.
AMAT earnings for the last quarter are 2.39 USD per share, whereas the estimation was 2.31 USD resulting in a 3.28% surprise. The estimated earnings for the next quarter are 2.36 USD per share. See more details about Applied Materials, Inc. earnings.
Applied Materials, Inc. revenue for the last quarter amounts to 7.10 B USD, despite the estimated figure of 7.13 B USD. In the next quarter, revenue is expected to reach 7.22 B USD.
AMAT net income for the last quarter is 2.14 B USD, while the quarter before that showed 1.19 B USD of net income which accounts for 80.34% change. Track more Applied Materials, Inc. financial stats to get the full picture.
Yes, AMAT dividends are paid quarterly. The last dividend per share was 0.46 USD. As of today, Dividend Yield (TTM)% is 0.89%. Tracking Applied Materials, Inc. dividends might help you take more informed decisions.
Applied Materials, Inc. dividend yield was 0.81% in 2024, and payout ratio reached 17.66%. The year before the numbers were 0.93% and 15.04% correspondingly. See high-dividend stocks and find more opportunities for your portfolio.
As of Jul 27, 2025, the company has 35.7 K employees. See our rating of the largest employees — is Applied Materials, Inc. on this list?
EBITDA measures a company's operating performance, its growth signifies an improvement in the efficiency of a company. Applied Materials, Inc. EBITDA is 8.74 B USD, and current EBITDA margin is 30.39%. See more stats in Applied Materials, Inc. financial statements.
Like other stocks, AMAT shares are traded on stock exchanges, e.g. Nasdaq, Nyse, Euronext, and the easiest way to buy them is through an online stock broker. To do this, you need to open an account and follow a broker's procedures, then start trading. You can trade Applied Materials, Inc. stock right from TradingView charts — choose your broker and connect to your account.
Investing in stocks requires a comprehensive research: you should carefully study all the available data, e.g. company's financials, related news, and its technical analysis. So Applied Materials, Inc. technincal analysis shows the neutral today, and its 1 week rating is buy. Since market conditions are prone to changes, it's worth looking a bit further into the future — according to the 1 month rating Applied Materials, Inc. stock shows the buy signal. See more of Applied Materials, Inc. technicals for a more comprehensive analysis.
If you're still not sure, try looking for inspiration in our curated watchlists.
If you're still not sure, try looking for inspiration in our curated watchlists.