$AMAT - Flagging in weekly, watch for break above 146 for calls$AMAT - Flagging in weekly, watch for break above 146 for long calls with stop loss of break down
AMAT trade ideas


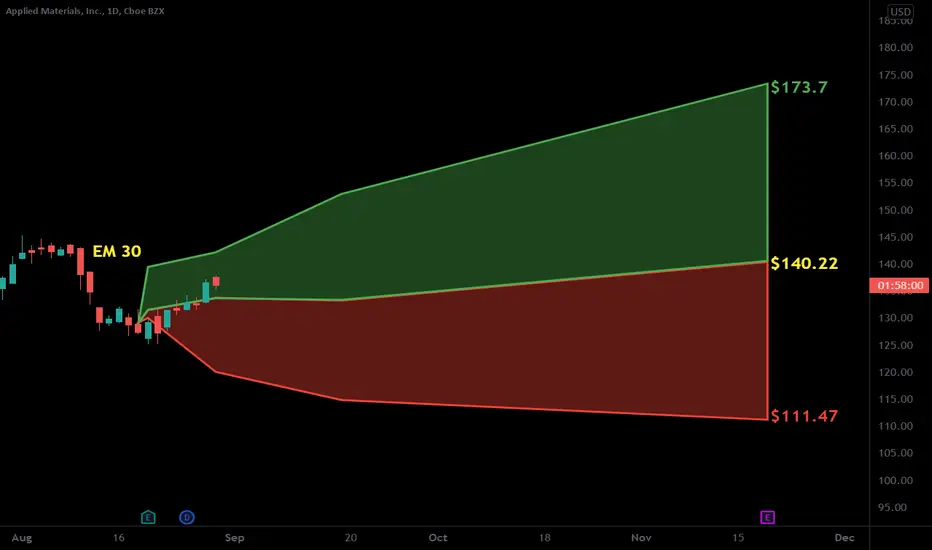
$AMAT Applied Materials on Breakout Alert
Hopefully you find the chart helpful in terms of Supports & Resistance etc.
we refrain from adding commentary on the chart as that is reserved for our members and we are very conscious of not giving financial or trading advice.
Thank you for taking time to consult our chart and we would really appreciate a like, follow or comment.

(US) AMAT VCP Setup Follow UpI shared AMAT previously at beginning of Aug (link below) and unfortunately the previous movement is not strong and the chart develop another contraction C3. The overall contraction for AMAT as shown below:
C1: -21%
C2: -12%
C3: -12%
C4: -4%
C5: -3%
Pivot point observed above the trendline. Awaiting volume and breakout!
Disclaimer:
Trade at your own risk. Not a buy call, sharing based on technical analysis with pattern and indicators.


short on AMATwe can open a short on it with a good R/R Because the price energy is low and needs some correction

AMAT: Trade the wedgeAMAT (swing): (In the process of filling the gap on the down)
~Watch the support zone 135.40-136.50 for a bounce to PT1: 138 / PT2: 140 / PT3: 144
~Monday may see a dip to 133-ish area, if support doesn't hold. I would buy calls at 133. (Price likely will recover 2 bucks after the pullback)
~We are still trading in a missive looking wedge and probably will be for at least another month. Take advantage of using the zone inside the wedge for the time being to make swings. (there is at least 10 bucks between the support and resistance line.)

AMAT short watchMassive penant getting tight. I have already bet on the downside, obviously could continue to the upside. Stay sharp.

strategy for AMAT Wednesday 09/01/2021(AMAT buy price 135.00)
(AMAT sell price 133.00)
strategy: amat with strong reversal signal. Here is the plan if you open with above and close to the closing price we wait for confirmation to enter the buy, we take profit in the double top. If the open is in zone # 2, for example 136.00, we wait for the break of the double top, our buy price is 138.00. Something important for amat is that it is in a divergence between the 5mn bearish charts, and the 15mn bullish charts, we must confirm the uptrend above the 5mn gr.
our bearish entry: it must be below the sell price and below the mv 200 by 15mn

$AMAT with a Bullish outlook following its earnings #Stocks The PEAD projected a Bullish outlook for $AMAT after a Positive over reaction following its earnings release placing the stock in drift B with an expected accuracy of 51%.
If you would like to see the Drift for another stock please message us. Also click on the Like Button if this was useful and follow us or join us.
AMAT running out of steamNASDAQ:AMAT has been seriously testing its dynamic support through last weeks earnings report, but has not yet posted a full daily candle beneath. Still, that support has been functionally invalidated by 4 successive candles poking through. In my opinion, a new technical structure is therefore forming. How price action respects the MA200 and/or key supports in the 115-120 range will help define the new channel and pattern.
The largest potential drop (excluding external catalysts) could be to the 118 level, i.e. at the confluence of the MA200 and 19MAY low.
Longer term, NASDAQ:AMAT will continue to post blowout earnings, which should lead to new ATH in late 2021/early 2022. In the meantime, we may see it continuing to trade on the lower side of FMV with a weak upward trend.

AMAT with upside 10%AMAT looks bullish, we can expect an exit from the triangle on volumes in the coming months.
take 1: 146$
take 2: 149$
stop-loss: 123-125$

Watchlist AMAT for a possible call: with TAOverall idea: If AMAT breaks 133.51, calls with a PT to 141.50 will be a go. (SL at 129.90)
TA:
~Accumulation/Distribution line is sharply increasing, foreshadowing a strong incoming bull action
~MACD has just crossed over into the positive, hinting at upcoming bull action
~VI is at an intersection point, foreshadowing a reversal in momentum from its previous bear action
~RSI is at 50, giving it room to go either direction without much fear of being overbought/oversold
~ so far there have been two rejections of the 50 EMA since August 10. We are rapidly approaching a third test of this 50 EMA, which is also at the point where AMAT would need to go to break resistance. Put the two together, if 133.51 is broken, we not only would see a break of resistance, but also a cross over the 50 ema after a bounce off the long term support line.
Also want to point out the obvious: the wedge that is forming long time frame.

AMAT needs to get back over trendlineI think AMAT can get a quick pop to reclaim the trendline. Once AMAT is back on top of trendline we could get a breakout over resistance and make a run.


$AMAT - Watch below 126 for puts$AMAT - Trend line break down & selling volume pressure, watch below 126 for puts

AMAT bounce?Looks like price bounced off the lower trend line. Earnings is coming up, but they've beat 4 out of 4. EPS keeps increasing each quarter.
I'm in if the price rises to $130.59. Good potential to raise the target. I'm probably being too conservative.
Weekly PUTS for Aug 20th are nice:
$120 bid of $0.61. -0.03 delta
$124 bid of $1.26
Earnings on the 19th.

AMAT SHORTWe need to wait until @134 then look for short or buy puts looking for a trend continuation.

AMAT - Forming Ascending TriangleAMAT price could currently be at a good entry zone. It has been forming higher lows with a resistance at around 145 level. Stop loss at previous swing low (124).

Amat earnings previewI like the long position here going into earnings for these 3 reaaons..
1.Bottom of channel
2.price is lower now than after last earnings (means earnings might not be priced in)
3. SMH ETF looks good and has also found support
Target prices are green lines

TrendyTrades: AMAT AnalysisBullish Harami, bottom of channel, bullish trendline bounce, gap fill above. Gap fill can be used for PT.

AMAT strange patternAMAT has had these ridiculous sell offs multiple times only to make a new highs 14 days after bottoming out at the trendline. Kinda silly, looking like easy money. Loading the boat with 9/3 call options. I don't know who is pulling the strings of the market but it looks like a damn bot. AMAT new all time high September 1st.

Time to buy the dip?AMAT has dropped 10%+ in the last 3 days, and it has reached the upward trendline. It could be a good time to buy the dip. Please wait for a bounce first before buying though.
For anyone who trade options, you could sell some OTM put options to get stock for a discount.
