AMD TRADE ALERT (07/24)
🚨 AMD TRADE ALERT (07/24) 🚨
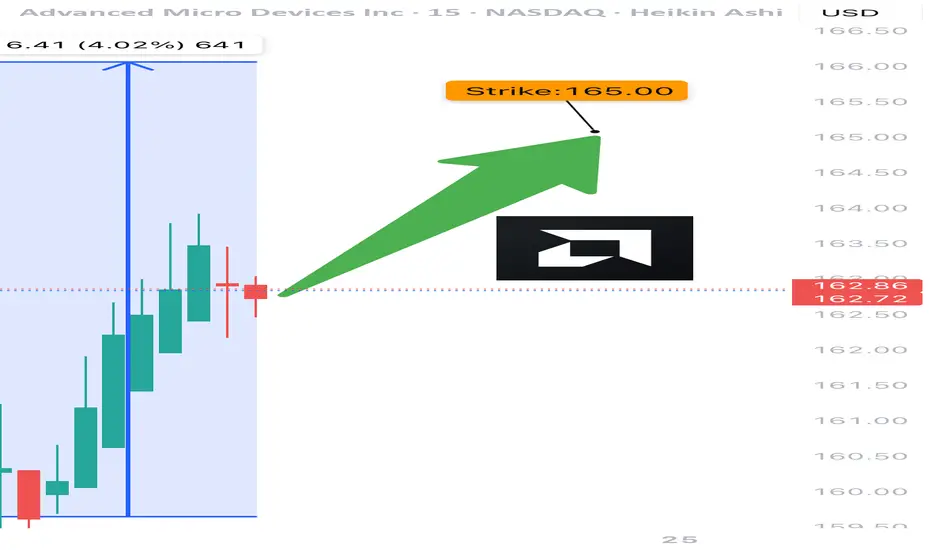
Options flow is screaming bullish 📈
🧠 Key Insights:
• Call/Put Ratio: 1.80 (🔥 heavy call bias)
• RSI: Daily 75.5 / Weekly 77.2 = strong momentum
• Volume = weak ⚠️ but sentiment remains bullish
• High gamma risk = explosive potential near expiry
💥 TRADE IDEA
🟢 Buy AMD $165 Call exp 7/25
💰 Entry: $0.80
🎯 Target: $1.60
🛑 Stop: $0.48
📊 Confidence: 75%
⚠️ Quick expiry = fast moves. Monitor closely.
#AMD #OptionsFlow #UnusualOptionsActivity #TradingView #OptionsTrading #BullishSetup #TechStocks #DayTrading #GammaSqueeze #OptionAlerts
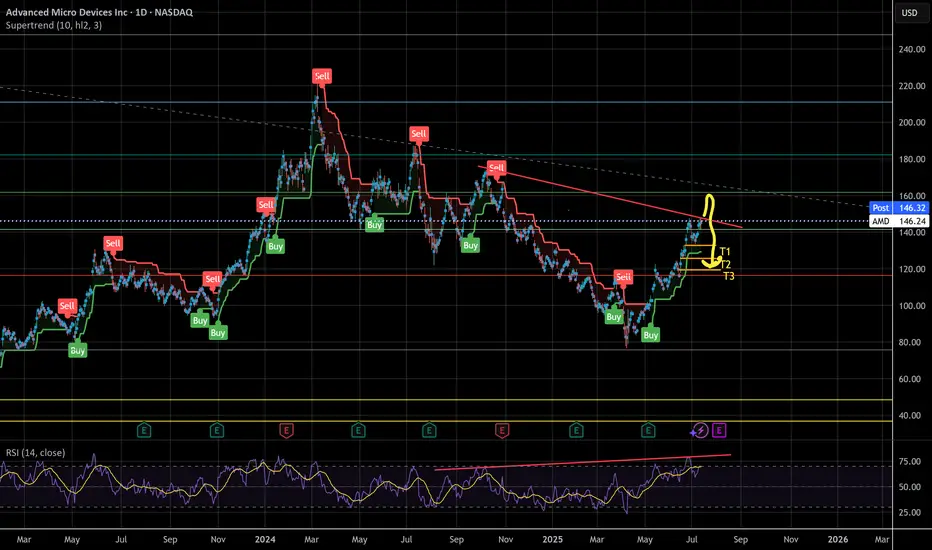
AMD trade ideas
Buy AMD with Confidence. Hello I am the Cafe Trader.
My goal is to help you find great pricing for your long term, and help you finesse your position the markets.
Today we are going to take a closer look at AMD.
As of right now AMD has just peeled off it's highs, gapping down. Is this where buyers are stepping in? Should you buy now? What are some short term plays that can maximize your profits?
CONTEXT
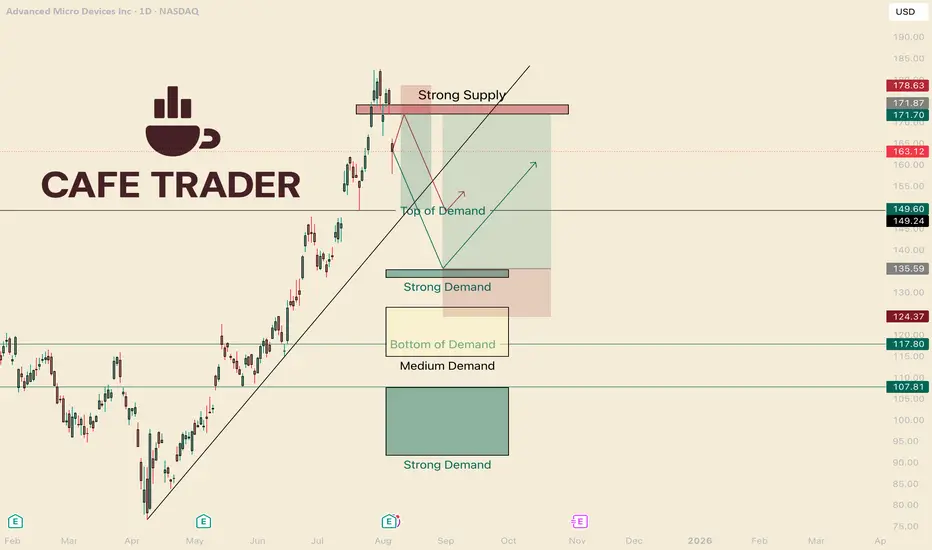
On the Chart I have labeled different levels of Demand. Knowing where the players are (buyers and sellers) can help us be surgical in price and timing.
In my opinion it is best to trade in terms of scenarios. How players react is just as important as Where they react.
For example: Say you are waiting in a long line for coffee. After some time, the line moves very slowly. We can start to ask questions, like "Why is this taking so long? How long will this take?"
"How" is an important question because we would have to examine how fast, or slow, the line is moving. We are in the dark with how big the current players are in the market.
Knowing "How" will help us position ourselves well with the other players. This lines us up for the best pricing, and helps us be able to get out of a position quick if we are wrong.
SHORT TERM
AMD had mixed earnings. This puts pressure on the buyers but they are still in control.
With a new seller inbound It's probable to hit the "Top of Demand" before breaking new highs.
Short Scenario (Red Line)
I think this will touch quick, reject, and then a few days of sideways before the real move down. You can take a Short right in this zone at 172, but if you buy puts, look to get good pricing. If we move up 4% the contracts might be too expensive to swing 3-5 days. I think after the touch, wait two days or so, and then look to get into some options.
Short (shares)
Entry 172
Stop 178.75
TP 150
Short (options)
Entry is after a test of the strong supply, wait a couple days.
Strike price: 160 Strike (or higher)
Premium: 4 to 1 R
$1.50 4-5 days TP $600
$2.50 6-10 days TP $1000
Long Scenario.
If we do not touch the strong supply before going down, This could drop aggressively. Unlike the previous scenario, I am expecting a hot reaction off the strong Demand area.
Long (shares)
Entry 135.50
Stop 124
TP 172
Long (options)
As soon as it touches, same day and next days contracts, 1 - 2 standard deviations outside the money. I think It can get to 140 minimum the same day.
Strike 136-137
Premium: 2.50-3.50 (if you get it cheaper, great!) Really this will depend on if it touches on a Monday, or a Friday lol.
TP 150% - 400%
LONG TERM
These prices should align with your own sentiment and Due Diligence of AMD.
Fair: $149.50 (Top of Demand)
Deal: $133.50 - 135.50 (Strong Demand)
Steal: anything under 108
(2nd Strong Demand)
Don't forget to Boost and follow!
More insight to come, and make sure you check out all my channels.
Much Love and Happy Trading!
@thecafetrader
AMD Post-Earnings: Sharp Drop Despite Solid RevenueDisclaimer:
This content is for informational and educational purposes only and does not constitute financial, investment, or trading advice. All opinions expressed are based on current market conditions and are subject to change without notice. You are solely responsible for your own trading decisions. Always conduct your own research and consult with a licensed financial advisor before making any investment decisions. Trading involves significant risk of loss and is not suitable for all investors.
---
AMD reported Q2 2025 revenue of $7.7B (↑32% YoY, beat est.), but shares fell >5% after hours. EPS met expectations at $0.48, yet margins were hit by an $800M China-related inventory charge.
Data center growth disappointed at +14%, missing high AI-driven expectations. Despite strong Q3 guidance ($8.7B rev), investors reacted to lack of MI308 revenue from China and slower AI chip ramp.
Forward view: All eyes on MI350 deployment, MI400 launch, and export license clarity. Execution must now justify elevated valuation. Until then, volatility likely persists.
---
I'm looking at these 4 trading ideas based on AMD's current setup post-earnings:
1. Short-Term Reversal Play (Swing Long)
Setup: AMD dropped >5% on earnings despite solid guidance.
Idea: Enter long near $165–168 support zone (post-earnings low) for a rebound to the $175–178 gap fill.
Risk: Tight stop under $163.
Catalyst: Oversold bounce + dip-buyers reacting to bullish Q3 outlook.
2. Gap-Fill Fade (Short-Term Short)
Setup: If AMD rallies into $177–179 to fill the earnings gap.
Idea: Enter short into resistance if volume fades or rejection confirms.
Target: $168–170.
Risk: Stop above $180.
Catalyst: Sell-the-news flow, especially if macro/headwinds persist.
3. Mid-Term Accumulation (AI Growth Thesis)
Setup: Valuation reset + long-term AI roadmap (MI350 → MI400).
Idea: Gradual long build on dips below $170, targeting $200+ by H1 2026.
Timeframe: 6–12 months.
Catalyst: China export resolution, MI400 launch, AI GPU traction.
4. Options Strategy: Neutral-to-Bullish Bias
Setup: IV remains elevated post-earnings, possible consolidation ahead.
Idea: Sell cash-secured puts at $160–165 or deploy bull put spreads (e.g., Sep $165/$155).
Objective: Profit from time decay if AMD holds range.
Catalyst: Theta income with defined risk while waiting for next trend.
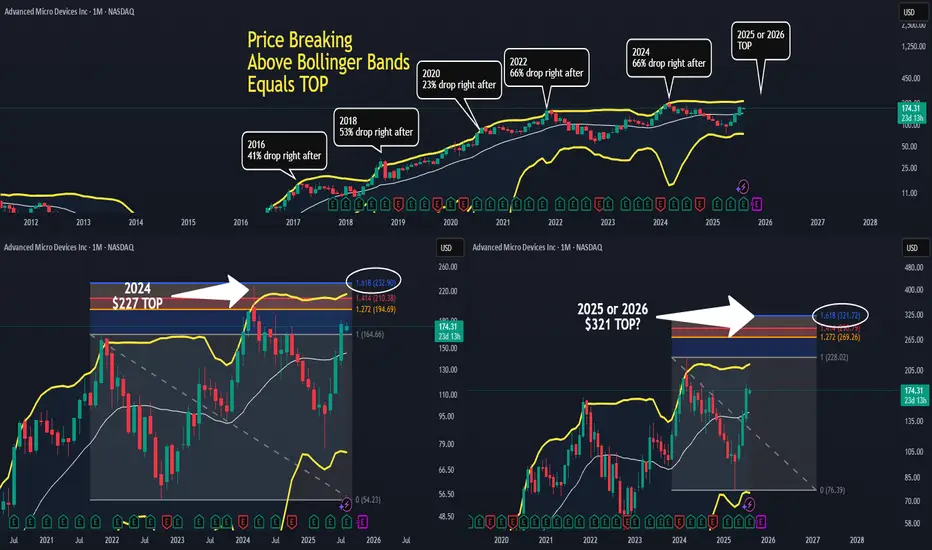
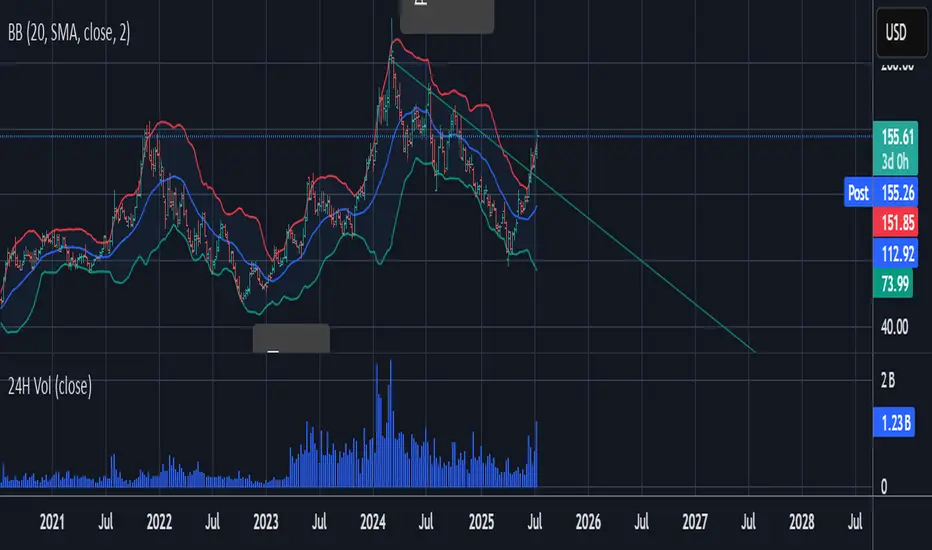
AMD - Finding Market TopAMD on the Monthly Chart using Bollinger Bands.
The Top Chart is a brief history of AMD's market tops.
Whenever price broke above the Bollinger Band (Yellow Band) that marked the top.
Bottom Left Chart is the 2024 market top.
Price broke above the Bollinger Band and headed towards the 1.618 Fibonacci.
It didn't hit the $232 exactly, but got very close.
Priced topped at $227.
Roughly a $5 difference.
Bottom Right Chart is the current price action.
The market cycle top should hit sometime in 2025 or 2026.
If the chart plays out like the previous pattern, then the 1.618 Fibonacci should be
the near target for the market cycle top.
This target is $321.
Will the market top hit $321 exactly?
I doubt it, but you never know.
But being honest, I did create a limit sell for $309.
We'll see how accurate I am.
I need to see price break above the Bollinger Band, then see how price
reacts to the Fibonacci ratios of 1.272, 1.414 and 1.618.
Fibonacci 1.272 is listed as $269, and Fibonacci 1.414 is at $290.
I could set limit sells at these three Fibonacci levels to better scale out of my positions.
AMD: 171.70Bullish Entry: 170.00 / 174.00 Stop 168.00 Bullish Target: 176.00 / 178.00 Stop 170.50
Bearish Entry: 170.00 / 166.00 Stop 170.50 Bearish Target: 164.00 / 162.00

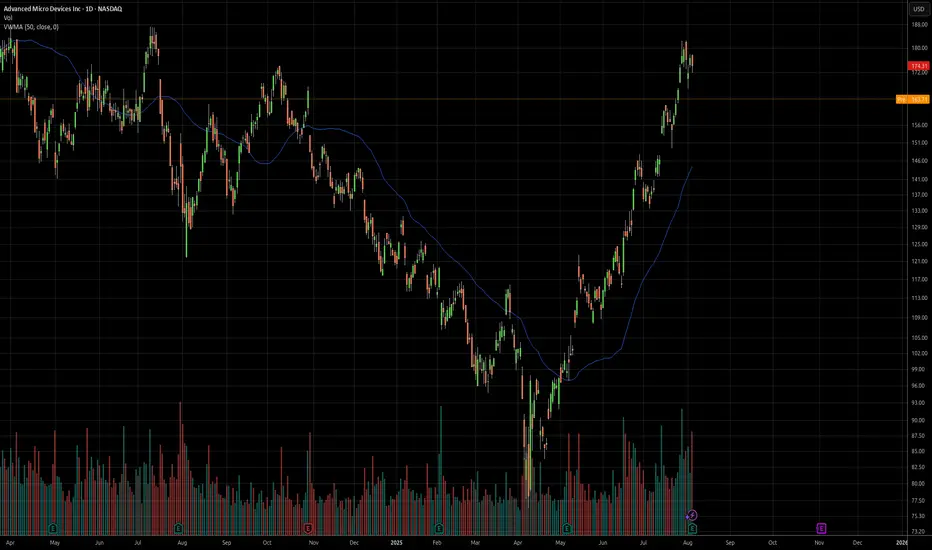
AMD coiling to $148-160 range by post-earnings- NASDAQ:AMD is one of the beaten down names. It's not too cheap at the current valuation but it's growth for upcoming 2-3 years are promising which deserves a higher multiple.
- 25%+ growth rate when revenue is in billions is a big deal unlike NASDAQ:PLTR which has high 20s % growth rate on a revenue of 250 mil a quarter.
- Technical supports strong rebound to 148-160 range to test 200 SMA. Good setup for Q1 2025.
- Downside risk is to 94-105 if it continues to meltdown.

AMD 1W: If Not Now — Then When?The weekly chart of AMD looks like it’s holding its breath: a well-defined falling wedge, double bottom support, and price pressing right against long-term trendline resistance. Everything’s in place — now it just needs to break and run, preferably without tripping over nearby Fibonacci levels.
The stock is trading around $114 and attempting to hold above the 50-week MA. Just ahead is the 200-week MA (~131) — not only a technical hurdle but also a psychological pivot. A move above it could reignite talk of $150+ targets.
The wedge has been narrowing since late 2024. After repeated bounces off support, price has returned to the top of the pattern. A confirmed weekly close above the wedge could trigger a real breakout. Without that — it risks yet another scripted pullback.
Key Fibonacci levels:
0.618 — $133.60
0.5 — $151.42
0.382 — $169.25
0.236 — $191.30
0.0 — $226.95 (all-time high)
The roadmap looks clean — but only if volume follows through. There are signs of quiet accumulation at the bottom, but no explosive buying just yet.
Fundamentals:
AMD delivered solid Q1 results: revenue is growing, EPS beat expectations, and margins are holding. More importantly, the company launched a new $6 billion stock buyback program — showing clear internal confidence in its long-term trajectory.
There’s also a strategic AI partnership underway with a Middle Eastern tech group. This move positions AMD to challenge not just for GPU market share, but for future AI infrastructure dominance — long game stuff.
Analyst sentiment has turned bullish again, with new price targets in the $130–150 range. All of this makes the current chart structure more than just technical noise — it’s backed by strong tailwinds.

Short - AMDTime period for this play : week to months
Analysis : Elliot wave 12345 ABC. Expect hitting .618 and bounce back up to go higher.
Pattern if wave B completed : Head & Shoulder
Price Target: Wave ABC
ETA Timeline for correction. Please refer to the chart.
Upcoming events:
Tariff active on 8/1/25 - Friday
Earning on 8/5/25 - Tuesday
Top is not in yet, so 2 Possible top-in levels:
Top 1 - $163.45 : Retesting to hit 163.45, rejected, and break $158
Top 2 - $173.94 : Breaking 163.45 and reject at 173.94
=> Overall, It begins trading side way and show some weakness now.
The correction may not pull back to .618, which is the best level. Other scenarios:
- 0.5 fib, where it test wave 3
- 0.328 fib, strong bullish level if it doesn't break & go to the upside faster

Why I Went Long on AMD Near the 2025 Lows🔍 Reason for the Trade
This wasn’t just a “buy the dip” setup — this was a calculated trade based on strong confluence:
✅ Multi-Year Demand Zone
Price returned to a massive support level that’s held since 2020. This zone had previously triggered multiple large bullish reversals.
✅ Falling Wedge Breakout
A textbook falling wedge pattern formed during the pullback. Once price broke out, the momentum confirmed a structural reversal.
✅ Risk/Reward Optimization
I positioned my stop just under key support, with targets set at prior structure highs. The setup offered a clean 2.5:1+ R/R ratio, perfect for swing conviction.
✅ Institutional Accumulation Area
The volume and wick rejections in this zone screamed smart money stepping in. It was a classic sign of fear-based selling into patient buyers.
🧠 Lessons Reinforced
- Wait for the Zone, Then Act: Patience paid off — the best trades come from the best levels.
- Structure Over Emotion: I trusted the technical, not the bearish headlines.
- R/R Always Wins: You don’t need to be right every time, but when you’re right — let it run.
#AMD #SwingTrade #TechnicalAnalysis #SupportAndResistance #WedgeBreakout #RiskReward #PriceAction #StockMarket #TradingView #TradeRecap

AMD enters new bullish rangeAMD has entered the bullish range I called for recently. I believe this will be a strong consolidation zone before new all-time highs. BBWP and stochastic will overheat here and need to reset. My target for the year is 235$.

AMD Analysis! Bullish 🔷 📝 AMD Analysis – GEN Methodology & Fibonacci Projection NASDAQ:AMD
✅ Chart Technique:
The blue overlay represents a historical price pattern (GEN Projection) applied to the current AMD chart using Bar Pattern Projection.
This technique forecasts potential timing and price movement based on similar past structures.
✅ Fibonacci Retracement (purple levels):
After the July high, a correction into the Golden Zone (0.618 at $109.16) was expected.
The current price is hovering around the 0.5–0.382 retracement levels ($119–129), suggesting potential support or a mid-term consolidation.
✅ Green box:
Marks a liquidity zone or accumulation area where the price may form a local bottom before continuation.
✅ Overall idea:
If the GEN Projection plays out, AMD could consolidate here before a strong rally towards new highs ($200+) in the coming months.
Invalidation: A clean break and daily close below the 0.618 Fibonacci ($109) would weaken this bullish scenario.

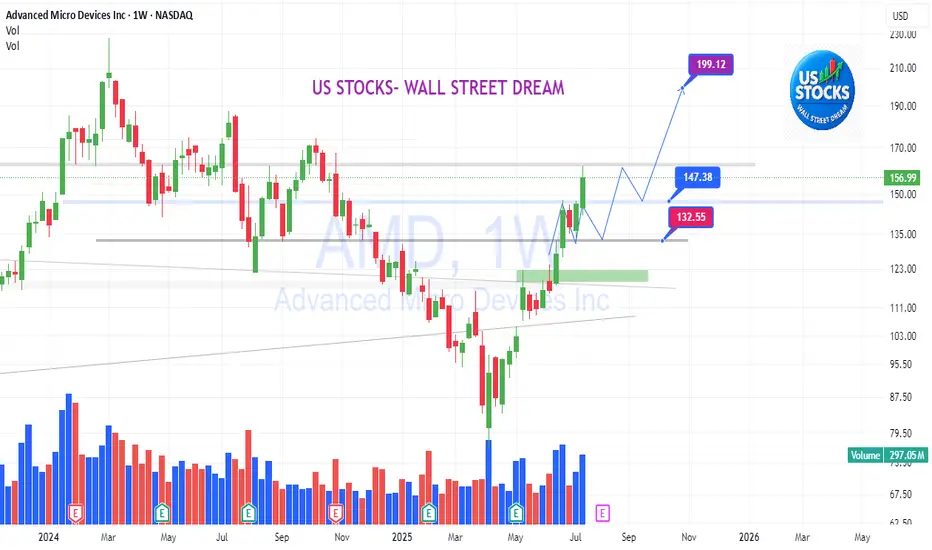
AMD: Next movements!AMD: Next movements!
Necessary backtest to rest, assess supply and demand, and reinforce the trend.
Wait to get on board with plan.
US STOCKS- WALL STREET DREAM- LET'S THE MARKET SPEAK!
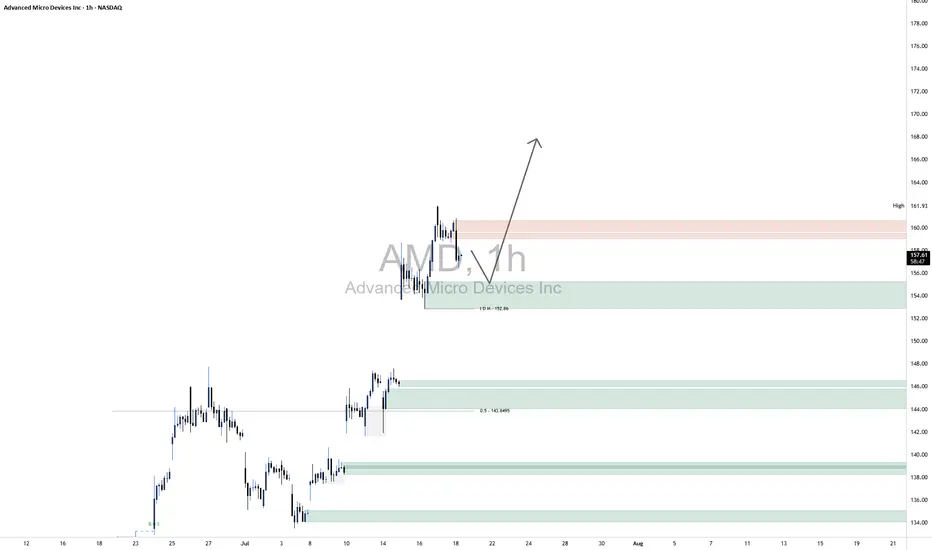
AMD LongKey Technical Insights:
Clean Rejection from Demand Zone:
Price recently tapped into a well-defined demand zone (highlighted green) around $152–$155.
The immediate bounce suggests that buyers stepped in with strength, likely absorbing sell-side liquidity.
Liquidity Grab Below Short-Term Lows:
Before the move up, price dipped just enough to trigger stops below recent lows, clearing out weak hands.
This kind of liquidity sweep is often used by smart money to build long positions before a directional push.
Current Price Action:
Price is consolidating just below a minor supply zone around $159–162.
This pause is constructive: it signals that momentum may be building for a breakout higher.
Upside Outlook (Based on Your Arrow)
Your arrow points to a bullish breakout — and that aligns well with current price structure.
Once supply near $161 is absorbed, price has a clear path to push toward the mid-160s and beyond.
The current higher-timeframe trend supports continuation, and any short-term dip into the $155–156 range may offer re-entry opportunities.
AMD Overview & Elliott Wave CycleAMD recently reported strong Q2 2025 results, with growth driven by Data Center and AI segments, notably thanks to the Instinct MI300 chip family. Revenue rose +15% YoY, with a significant boost from AI-related demand. Future projects include next-gen GPUs, AI platforms, deeper cloud integration, and investments in 3nm architectures.
From a technical perspective, AMD appears to be in a primary Elliott Wave cycle, which may have begun around October 2022. Such cycles typically last between 3 and 10 years. This insight comes from years of study, hands-on practice, and applied quantitative models,not guesswork.
If you found this interesting, share it with others: spreading thoughtful analysis matters.

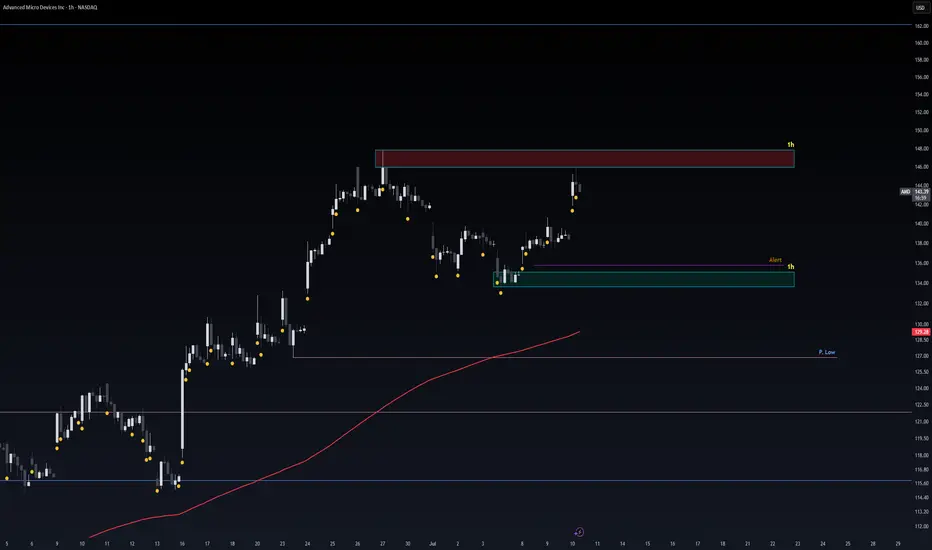
The AMD Long Heist – Ready to Rob the Bulls?!🚨 AMD Stock Vault Heist: Bullish Breakout Plan with Thief Trading Style! 📈💰
🌟 Greetings, Wealth Raiders & Market Mavericks! 🌟
Hello, Ciao, Salaam, Bonjour, and Hola to all you savvy traders! Ready to crack the AMD Stock Vault (Advanced Micro Devices Inc.) with our 🔥 Thief Trading Style 🔥? This high-energy strategy blends technical precision with fundamental firepower to execute the ultimate market heist. Let’s dive into the plan, lock in profits, and escape the high-risk resistance zone like pros! 🏆💸
📝 The Heist Plan: AMD Bullish Breakout Strategy
Our chart lays out a long-entry blueprint designed to capitalize on AMD’s bullish momentum. The goal? Swipe the profits and exit before the bears take control at the resistance zone. This is a high-reward, high-risk setup, so stay sharp! ⚠️
📈 Entry: Crack the Vault!
Timing: Strike when the vault is open! Place buy limit orders on pullbacks within a 15 or 30-minute timeframe targeting the most recent swing low or high.
Tactic: Use a Dollar Cost Averaging (DCA) or layering strategy to stack multiple entries for optimal positioning.
Pro Tip: Look for bullish confirmation (e.g., candlestick patterns or volume spikes) to ensure you’re entering with momentum. 🚀
🛑 Stop Loss: Secure the Getaway!
Place your stop loss below the nearest swing low on the 3-hour timeframe (around $148.00 for day/swing trades).
Adjust based on your risk tolerance, lot size, and number of layered entries.
Why? This protects your capital from sudden reversals while giving the trade room to breathe. 🛡️
🎯 Target: Cash Out Big!
Aim for $179.00, a key resistance zone where bears may counterattack.
Watch for signs of overbought conditions or consolidation near this level—be ready to take profits and treat yourself! 💪🎉
💡 Why AMD? The Fundamental Fuel ⛽
AMD’s bullish surge is powered by:
Tech Sector Momentum: Strong demand for semiconductors and AI-driven chips.
COT Report Insights: Institutional buying pressure (check latest Friday COT data, UTC+1). 📅
Macro Tailwinds: Favorable economic conditions and positive sentiment in tech indices.
Geopolitical Stability: No major disruptions impacting tech supply chains.
Intermarket Edge: Monitor NASDAQ 100 and semiconductor ETFs for correlated moves. 📊
For a deeper dive, review:
Macroeconomic trends
Sentiment analysis
Index-specific correlations
Future price projections (overall outlook score: Bullish). 🌎
⚠️ Trading Alert: Navigate News & Volatility 📰
News releases can shake up the market like a rogue alarm system! To stay safe:
Avoid new trades during major news events (e.g., earnings or Fed announcements).
Use trailing stop-loss orders to lock in profits and protect open positions.
Stay agile—monitor real-time updates to adjust your strategy. 🚨
📌 Risk Disclaimer
This analysis is for educational purposes only and not personalized investment advice. Always conduct your own research, assess your risk tolerance, and align your trades with your financial goals. Markets move fast—stay informed and adaptable! 📚
💥 Boost the Heist! 💥
Love this Thief Trading Style? Smash the Boost Button to supercharge our robbery squad! 💪 Every like and share fuels our mission to conquer the markets with ease. Join the team, steal the profits, and let’s make money rain! 🌧️💰
Stay tuned for the next heist plan, you legendary traders! 🤑🐱👤🚀

AMD in cross section of 2 important levelsAMD is at the crosssection of 2 important
trend lines
1. from Jun22 lows to sep23 lows and Aug 24 lows,
breaking down in Dec24.
2. The channel from Mar24.
I hope the price comes down to 133 levels.

AMD is a strong buyAs mentioned, NVIDIA is overbought RSI over and other indicators. Put your bets on AMD.
7/15 AMD short AMD just reached a major resistance level and is expected to pull back toward the $135 area. While it may not signal a full trend reversal, a retracement from today’s high is likely.
If the 7/15 candle forms a red shooting star, it would provide further confirmation.
May the trend be with you.

Advanced Micro Devices | AMD | Long at $126.00Advanced Micro Devices NASDAQ:AMD may be the sleeping giant in the semiconductor / AI space. While all eyes on NVidia NASDAQ:NVDA , earnings for NASDAQ:AMD grew by 800% over the past year... and are now forecast to grow 40% per year. Any other company would be soaring right now (like NVidia), but that company is getting all the attention. And, to me, this means opportunity for the future. The cashflow is likely to grow tremendously for
NASDAQ:AMD into 2027 and beyond, which may inevitably reward investors with dividends.
From a technical analysis perspective, NASDAQ:AMD just entered my historical simple moving average zone. This area (currently $108-$126) is where I will be gathering shares. Something tremendous would have to change regarding the fundamentals of this company (like a scandal) for the overall thesis to change. There may be some near-term price pains as NVidia gets all the focus, but to meet demand in the semiconductor and AI space, NASDAQ:AMD is poised to fulfill that roll in the future.
Target #1 = $158.00
Target #2 = $175.00
Target #3 = $188.00
Target #4 = $205.00

Safe Entry Zone AMDPrice Rejected From Resistance.
Safe Entry Green Zone.
Target after that 162$ price level.
Note: 1- Potentional of Strong Buying Zone:
We have two scenarios must happen at The Mentioned Zone:
Scenarios One: strong buying volume with reversal Candle.
Scenarios Two: Fake Break-Out of The Buying Zone.
Both indicate buyers stepping in strongly. NEVER Join in unless one showed up.
2- How to Buy Stock (safe way):
On 1H TF when Marubozu/Doji Candle show up which indicate strong buyers stepping-in.
Buy on 0.5 Fibo Level of the Marubozu/Doji Candle, because price will always and always re-test the
Take Care & Watch OUT !
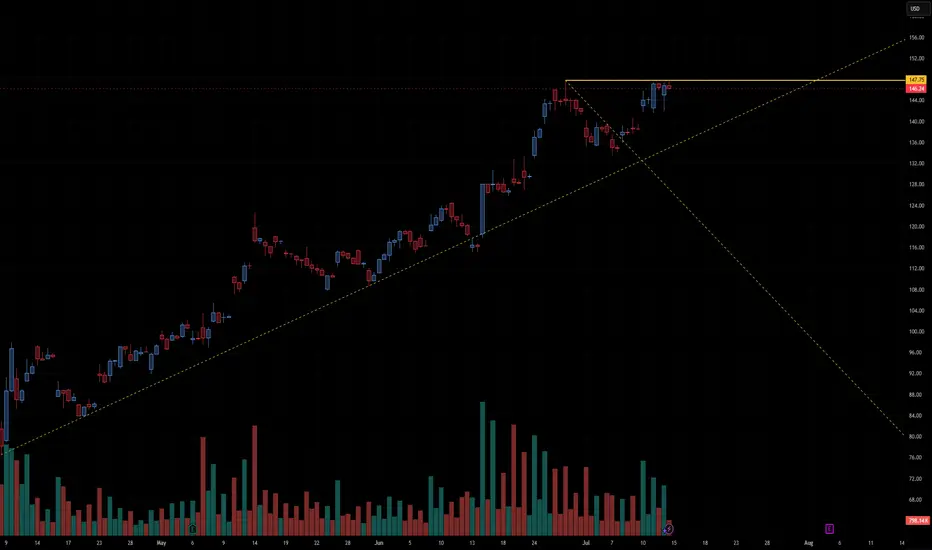
AMD preparing to break out or fail at resistance🔍 Chart Structure & Key Levels
Horizontal Resistance:
The stock is repeatedly testing the $147.75 level, which is acting as a horizontal resistance (shown in orange). Price has stalled here for several sessions, creating a tight range just below resistance—a common precursor to breakouts.
Ascending Trendline Support:
A long-term upward trendline (dashed yellow) supports the current move. Price has respected this line multiple times, showing a strong bullish structure over the past few months.
Volume Analysis:
Volume has decreased during the recent consolidation near the highs, which is typical before a breakout. However, we want to see a volume spike on a confirmed breakout above $147.75 to validate strength.
Symmetrical Triangle / Coil:
There's a tightening pattern forming between the rising trendline and the flat resistance, indicating price compression. This type of structure is often resolved with a large directional move.
✅ Bullish Scenario
A confirmed breakout above $147.75 with volume expansion could trigger a strong upward move.
Price could quickly target the psychological level near $150, and potentially beyond to $155+, based on the height of the prior impulse wave.
⚠️ Bearish Breakdown Scenario
If price fails to break above $147.75 and breaks the ascending trendline, a pullback to $140 or $135 becomes likely.
A breakdown would invalidate the current bullish structure and signal a potential short-term reversal.
🧠 Summary
This chart is in a bullish consolidation with a coiled setup just under major resistance. A breakout above $147.75 is the critical level to watch for upside continuation. Traders should monitor volume and candlestick confirmation before entering positions.
Must go down to go upI think AMD needs to cool off before it continues further, possibly tapping $160 first before a serious correction. Targets are listed at the strong support ending at $120. RSI printing bearish divergence on multiple time frames
Look at the red line, look at the direction of price. It's still a downtrend.
Stocks SPOT ACCOUNT: AMD stocks buy trade with take profitStocks SPOT ACCOUNT: NASDAQ:AMD stocks my buy trade with take profit.
This is my SPOT Accounts for Stocks Portfolio.
Trade shows my Buying and Take Profit Level.
Spot account doesn't need SL because its stocks buying account.
