AMKR – 30-Min Short Trade Setup!📉 🔻
🔹 Asset: Amkor Technology, Inc. (AMKR – NASDAQ)
🔹 Timeframe: 30-Min Chart
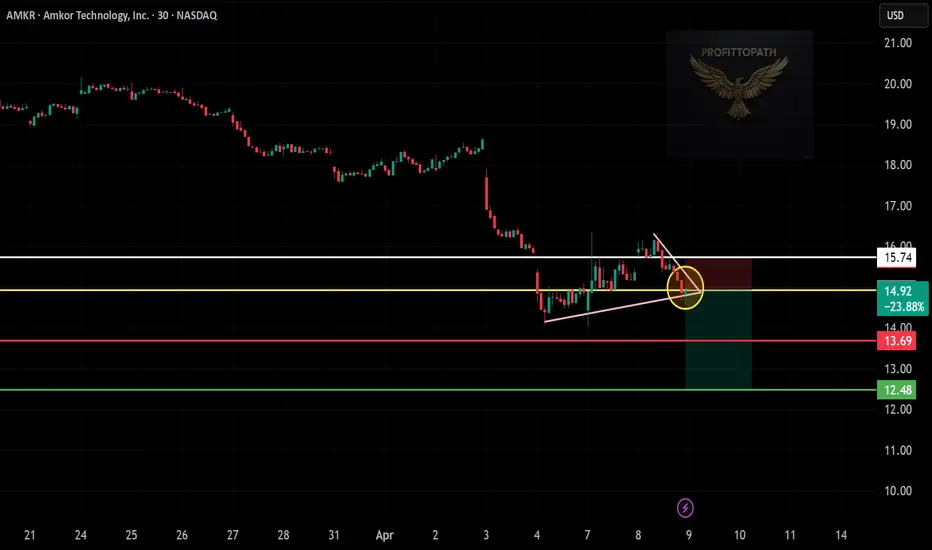
🔹 Setup Type: Rising Wedge Breakdown + Retest Rejection
📊 Trade Plan (Short Position)
✅ Entry Zone: Below $14.90 (Confirmed Breakdown)
✅ Stop-Loss (SL): Above $15.74 (White resistance zone)
🎯 Take Profit Targets:
📌 TP1: $14.00 (psychological level + previous support)
📌 TP2: $13.69 (breakdown structure)
📌 TP3: $12.48 (major support level)
📐 Risk-Reward Ratio Calculation
📉 Risk (SL Distance):
$15.74 - $14.90 = $0.84 risk per share
📈 Reward to TP2:
$14.90 - $13.69 = $1.21 → R/R = 1:1.44
📈 Reward to TP3:
$14.90 - $12.48 = $2.42 → R/R = 1:2.88
🔍 Technical Analysis & Strategy
📌 Rising Wedge Breakdown: Bearish structure broken with weak bounce back
📌 Trendline Retest Rejected: Price failed to reclaim wedge support
📌 Bearish Volume Confirmation: No strong buying after breakdown
📌 Downside Open: Clear path toward lower support levels
📉 Trade Execution & Risk Management
📊 Entry Confirmation: Weak price action below $14.90
📉 Trailing Stop Strategy: Move SL to breakeven after TP1 hits
💰 Partial Profit Booking:
✔ Book 50% profits at $13.69
✔ Let rest ride to $12.48
✔ Adjust SL to entry after TP1
⚠️ Setup Invalidation
❌ Price reclaims and closes above $15.74
❌ Strong bullish reversal candle with high volume
❌ Sustained consolidation above yellow zone
🚨 Final Thoughts
✔ Clean bearish wedge pattern with trendline break
✔ Ideal for momentum traders seeking continuation plays
✔ Excellent R/R for disciplined risk managers
💡 Stick to the setup, don’t chase, manage your trade like a pro.
🔗 #AMKR #NASDAQ #BearishSetup #ProfittoPath #StockTrading #ShortSetup #RisingWedge #TechnicalAnalysis #TradingPlan #RiskReward
AMKR trade ideas
Can it gain a foothold in technology? $AMKRFounded in 1968 and headquartered in Tempe, Arizona. The company provides outsourced semiconductor packaging and testing services in the US, Japan, Europe, Middle East, Africa and Asia Pacific regions.
In 2023, Amkor's total revenue was $6.5 billion, a decrease of 8.3% from 2022. Its revenues have fluctuated over the last decade, increasing from $6.14 billion in 2021 to $7.09 billion in 2022.
Amkor has demonstrated strong performance in flip chip scale package products, particularly for smartphones, tablets and other mobile consumer electronic devices. It also offers a variety of packaging solutions for networking, storage, computing, automotive and consumer applications
Amkor Technology is a major player in the semiconductor industry, offering a wide range of solutions to its customers with innovative packaging and testing services.

💡 Amkor Technology ($AMKR) 💡 Amkor Technology ( NASDAQ:AMKR ) joins PHLX Semiconductor Sector Index (SOX), a top 30 US-listed semiconductor player! Q3 sales poised for all-time highs at $1.775B, a robust 22% QoQ surge. Strong balance sheet: $1.2B cash, outpacing $1.13B debt.
📈 Bullish outlook holds firm above $24.00-$25.00, eyeing an upside target of $40.00-$42.00.
#AmkorTechnology #TechNews #Semiconductors #BullishOutlook

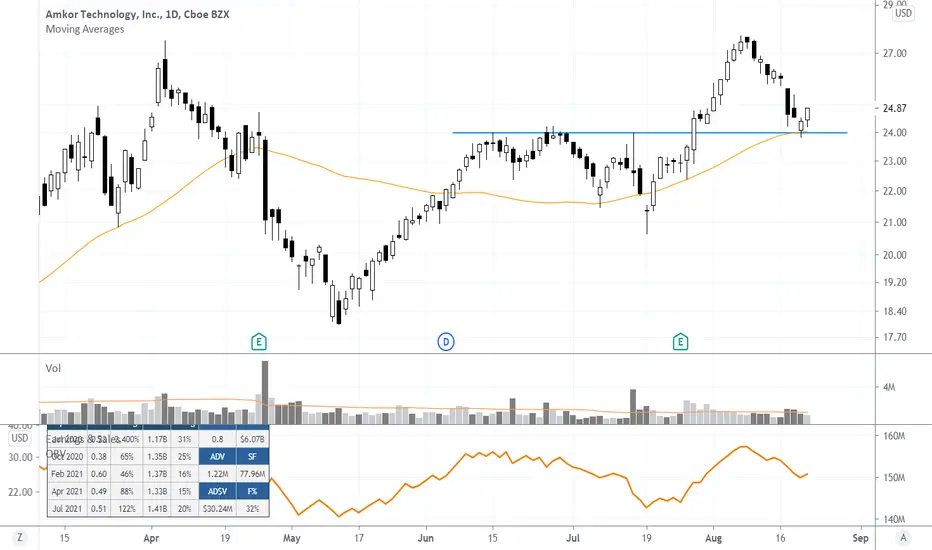
AMKR - Double Top Breaking CurveViewing the curved channel we can see that their is an evident double top formed within it.
This will likely break down and break this curve, which is standard for a double top pattern.
Bearish

AMKR - Amkor Technology, Inc.Top of my focus list going into the upcoming week. Growth numbers are good, increasing number of funds buying shares, earnings still two weeks away.
On a technical basis, a surge in volume took prices thru some key highs and now we're seeing an orderly consolidation with good looking volume patterns.
Ideally, we get another volume surge that takes us thru last week's highs around 30.50.

AMKR - RETRACEMENTWave 5 is over.
AMKR needs rest . We would wait for Wave A completion to Bull.
Good luck

AMKR is a long term for me AMKR is showing a really strong upward trend on the daily and weekly chart. Today it has broken its daily resistance $24.92 - $25.74. I'm looking for a continuation of this uptrend. This will be a good Leap for me.

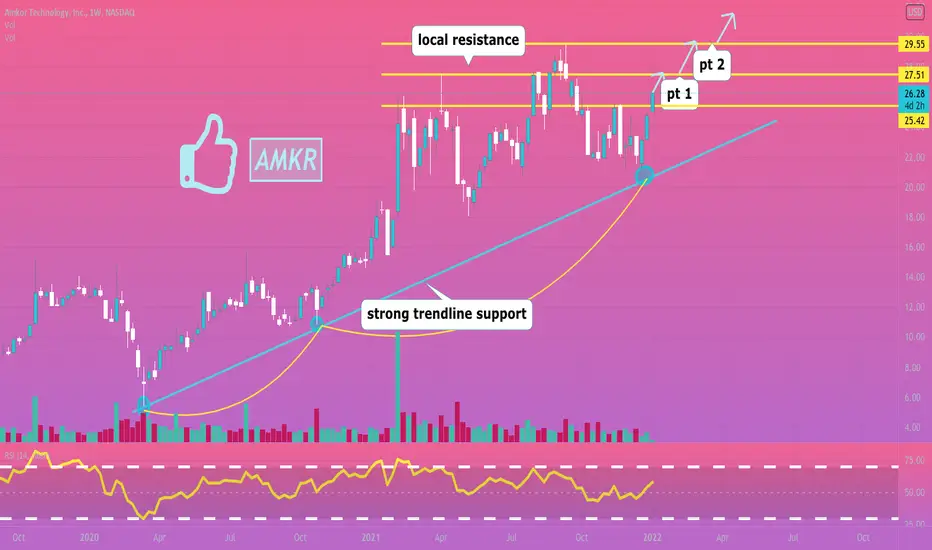
looking for continuation ✅amkr breaking 1/3 local resistance levels today, recently saw a perfect bounce off its strong trendline support.
all good signs for longs, we most likely see price targets 1-2 hit in the next few weeks. A all time high break should follow.
like and follow for more 💘
Amkor ABCA 50M
B 102M
C 78M
31thDec 6.1M...
Elliott Wave Theory, or ABC wave theory, is a term for three-wave counter trend price movement. Here, wave A is the first price wave that is against the trend of the entire market. B wave is a corrective wave for wave A. Wave C shows the final price move to complete the counter trend price move.

Buy AMKR 21/10/2021You can buy AMKR target 27.04 stop loss 21.18
Money management your responsibility.
I recommend entering a maximum of 10% of the portfolio.
Good luck

ATH or Wave 5AMKOR again hit all time high, will its go high and higher or otherwise as completing wave 5. let study together

AMKR close to a breakoutGreat run-up to resistance
6 green candles in a row
Price well above 200 DMA
5 Month-long base
Dividend-paying stock

AMKR on watchWith SMH set to breakout this may be one to watch. Nice setup with there having been a few touches on the this high already. Like it in the box to fib levels above. No longer interested below the box.

$AMKR Breakout Pullback Setup$AMKR breakout pullback setup. That 50 day MA is conversing with most recent breakout pivot. A high probability PB trade setup.
AMKR.NAS_Swim Trading VZ Breakout Trade_LongENTRY: 24.30
SL: 22
TP1: 26.07
TP2: 27.50
- ADX<25. Would like to be higher.
- RSI<65 but >50. Uptrend still intact.
- RS +ve
- FFI +ve
- MAs aligned

Trading Idea - Amkor TechnologyBUY
ENTRY: 23.53 USD
TARGET: 26.10 USD (+11%)
STOP: 22.33 USD
1.) rejection at the uptrend support level. uptrend continuation.
2.) retest of the resistance level expected
3.) For the past year, the analysts have regularly revised their sales expectations for the company upwards.
4.) The company has enjoyed very extensive upward revisions over the past 4 months to its net profit estimate.
5.) During the weekly observation period, the share is in a technical constellation that could cause prices to rise above the support at USD 15.52.


BUY $AMKRAny dip on the Stochastic is a buy in my opinion. As long as it holds the top of the triangle we could push higher.


Practice Drawing "Fair Value Areas" (FVA's) and Excess Price.I have some text on the chart that explains a little bit. The idea is I'm trying to do some active reading from the book called "Price Action Breakdown". The first chapter suggests you do this exercise. That is my only goal with this. If there is someone else in the learning stages, or refreshing stages, please feel free to comment how you would do it differently, or parts that you found agreeable.


$AMKR - gap fillI have alert for the gap fill area. Most gaps fill
It does have a bit of a bull pennant, so this may need to go up before it comes down.
Patience is a virtue.

AMKR ready to flyAn Amazing setup in my opinion. A gap and then a descending triangle, retested a support from the 2000's and on its way back up. Definitely has up side soon! This is just an idea, Not investment advice.
