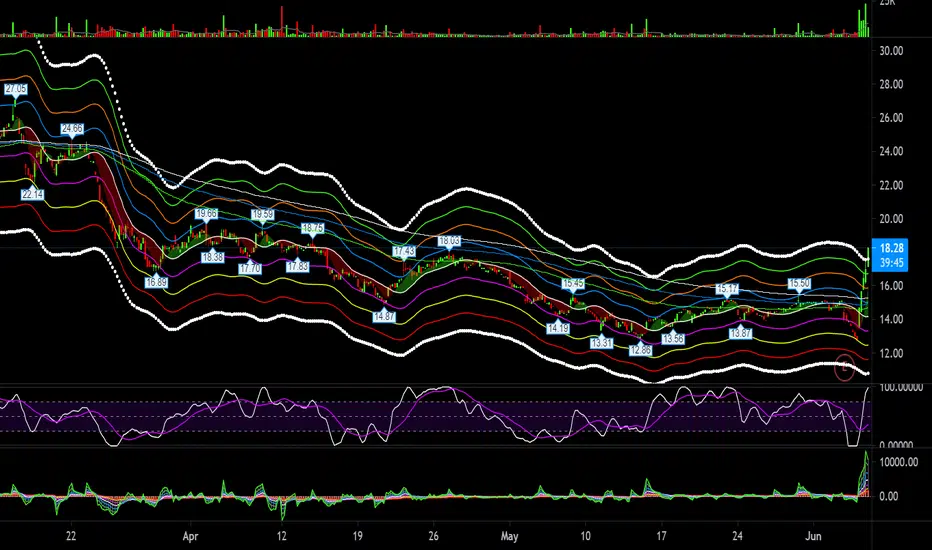
AMSC - Bullish Breakout? Watch for it. Watch for break of $18. If breaks and confirmed break, could soar to $39 (estimate).
AMSC trade ideas

Amsc breaking out of a descending channel Price looks set to push higher after months of retracement.

American Superconductor gains +40% on 9xs average daily volumeOn 6/2/21 American Superconductor (AMSC) reported a Q4 March 2021 loss of $0.21 per share on revenue of $21.2 million. The consensus estimate was a loss of $0.21 per share on revenue of $19.6 million. Revenue grew 16.7% on a year-over-year basis. The company said it expects a first quarter non-GAAP loss of $0.17 per share or better on revenue of $22 million to $26 million. The current consensus estimate is a loss of $0.18 per share on revenue of $20.25 million for Q1 ending June 30, 2021.
breakout = $17.60
R3 = $16.72
R2 = $15.85
R1 = $14.98
pivot = $14.17
S1 = $13.36
S2 = $12.49
S3 = $11.62
breakdown = $10.81
Do your own due diligence, your risk is 100% your responsibility. This is for educational and entertainment purposes only. You win some or you learn some. Consider being charitable with some of your profit to help humankind. Good luck and happy trading friends...
*3x lucky 7s of trading*
7pt Trading compass:
Price action, entry/exit
Volume average/direction
Trend, patterns, momentum
Newsworthy current events
Revenue
Earnings
Balance sheet
7 Common mistakes:
+5% portfolio trades, capital risk management
Beware of analysts motives
Emotions & Opinions
FOMO : bad timing
Lack of planning & discipline
Forgetting restraint
Obdurate repetitive errors, no adaptation
7 Important tools:
Trading View app!, Brokerage UI
Accurate indicators & settings
Wide screen monitor/s
Trading log (pencil & graph paper)
Big organized desk
Reading books, playing chess
Sorted watch-list
Checkout my indicators:
Fibonacci VIP - volume
Fibonacci MA7 - price
pi RSI - trend momentum
TTC - trend channel
AlertiT - notification
www.tradingview.com
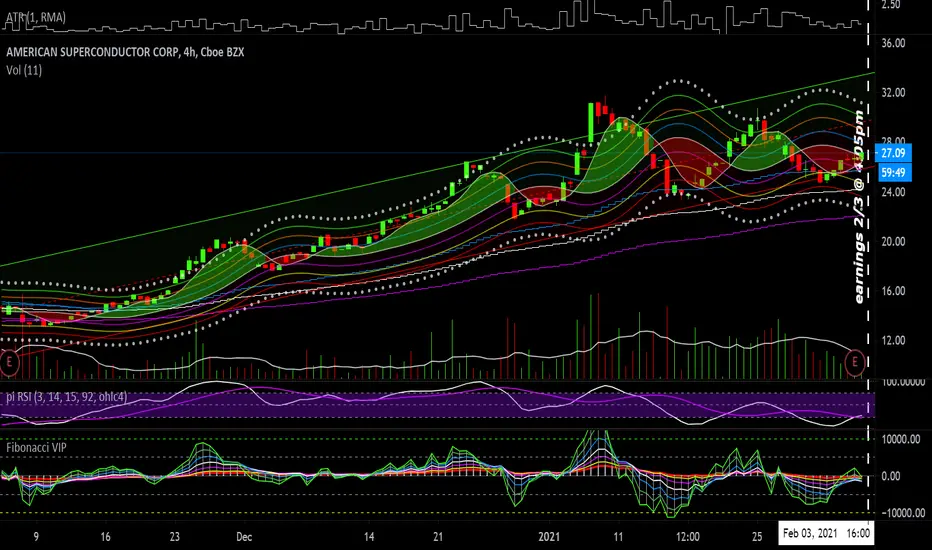
American Superconductor earnings today @ 4:05pmAmerican Superconductor earnings are today at 4:05pm. My range is low $25, mid $29, high $33. American Superconductor Corporation is a leading energy technologies company. The company develops and sells a wide range of products and solutions based on power electronic systems and high temperature superconductor wires that dramatically improve the efficiency, reliability and quality of electricity during its generation, transmission, distribution and use. The company is a dominant force in alternative energy, offering grid interconnection solutions as well as licensed wind energy designs and electrical systems. As the world's principal supplier of HTS wire, AMSC is enabling a new generation of compact, high-power electrical products, including power cables, grid-level surge protectors, motors, generators, and advanced transportation and defense systems. AMSC also provides utility and industrial customers worldwide with voltage regulation systems that dramatically enhance power grid capacity, reliability and security, as well as industrial productivity.
3rd Quarter December 2020
Consensus =
EPS: ($0.20)
Revenue: $23.20 Million
Do your own due diligence, your risk is 100% your responsibility. You win some or you learn some. Consider being charitable with some of your profit to help humankind. Small incremental steps work : If you double a penny a day for a month it = $5,368,709. Good luck and happy trading friends...
*3x lucky 7s of trading*
7pt Trading compass:
Price action, entry/exit
Volume average/direction
Trend, patterns, momentum
Newsworthy current events
Revenue
Earnings
Balance sheet
7 Common mistakes:
+5% portfolio trades, risk management
Beware of analysts motives
Emotions & Opinions
FOMO : bad timing
Lack of planning & discipline
Forgetting restraint
Obdurate repetitive errors, no adaptation
7 Important tools:
Trading View app!, Brokerage UI
Accurate indicators & settings
Wide screen monitor/s
Trading log (pencil & graph paper)
Big organized desk
Reading books, playing chess
Sorted watch-list
Checkout my indicators:
Fibonacci VIP - volume
Fibonacci MA7 - price
pi RSI - trend momentum
TTC - trend channel
AlertiT - notification
www.tradingview.com

AMSC Short Idea: At Parallel Top Trend line with bearish engulfAMSC is current at the top parallel trendline, extended from the lower previous pivot minima. 12/1 candle was a bearish engulfing and the low of that candle was broken 12/2. Look for a potential change in trend to the downside over the next few weeks/months.

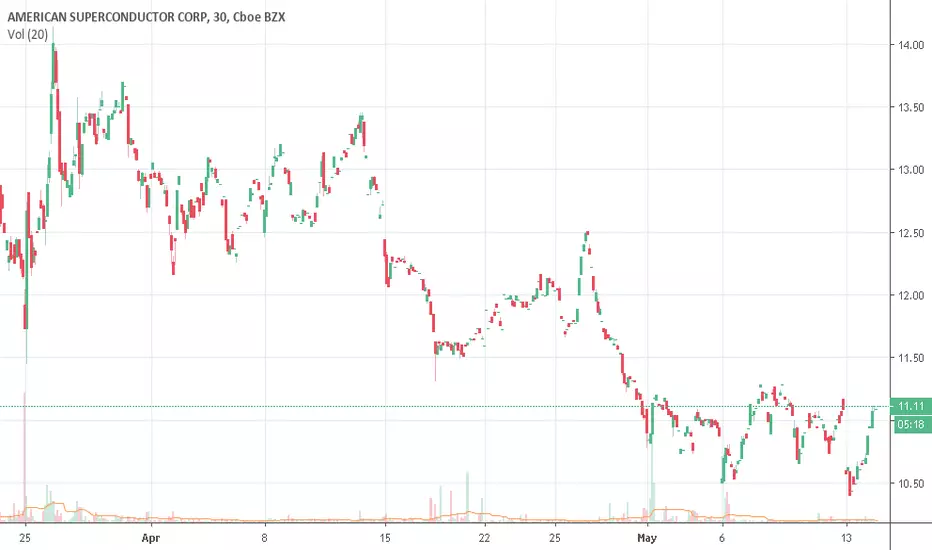
Flag patternthis ticker is forming a flag pattern. I am waiting for a buy signal (breakout and high volume)


AMSC Aroon Indicator entered an Uptrend on July 28, 2020Over the last three days, I have detected that AMSC's AroonUp green line is above 70, while the AroonDown red line is below 30. When the green line goes above 70 while the red line stays below 30, this is an indicator that the stock could be poised for a strong Uptrend. For traders, this could mean going long the stock or exploring call options in the next month. I backtested this indicator and found 168 similar cases, 153 of which were successful. Based on this data, the odds of success are 90%.

pull back has been formed for another surgethey have recently been awarded with a new contract, the future is looking good for this stock.
Looking at the price I do think the price of the stock is still cheap and it should be valued to $14 at least.
Please like and follow for more


$AMSC can rise in the next daysContextual immersion trading strategy idea.
American Superconductor Corporation provides megawatt-scale solutions.
The share price rose after good earnings. I see some preconditions the share price will continue growing.
The demand for shares of the company still looks higher than the supply.
These and other conditions can cause a rise in the share price in the next days.
So I opened a long position from $8,15;
stop-loss — $8,03.
Information about take-profits will be later.
Do not view this idea as a recommendation for trading or investing. It is published only to introduce my own vision.
Always do your own analysis before making deals. When you use any materials, do not rely on blind trust.
You should remember that isolated deals do not give systematic profit, so trade/invest using a developed strategy.
If you like my content, you can subscribe to the news and receive my fresh ideas.
Thanks for being with me!


AMERICAN SUPERCONDUCTOR BULLISH INVERSION The prices have rebounded on the 200 SMA weekly. Long from that level for a bullish inversion. Stop if the prices will lose the red SMA.

AMSC Awarded Delivery Contract for Ship Protection System on LPDAMSC: AMSC
2019-05-13 16:05:00
AMSC Awarded Delivery Contract for Ship Protection System on LPD 30 - GlobeNewswire

AMSC: Broke the 0.618 fib and no stopping nowThis will pick up some speed on the downside and will pay very handsomely for my long dated puts. The show has just begun and cannot wait for the earnings.

AMSC: I got a lead on this name and trusting it 100%Spending too much time in cutting and slicing. This will be fun. 5% of trading fund is in this name now. Keeping an eye on this and not selling this.

AMSCPull Back Trading
Price above the cloud ( bullish )
Above 200MA ( bullish )
Buy $14.74
Take Profit: 17.30 R=2
Stop Loss: $13.46
Thank You
All comments are welcome

AMSC Long - Bounce off trend support and EMAAMSC bullish reversal pattern.
Hammer candlestick hit the supporting trend line
Hammer candlestick supported by EMA20.

ASMC super bullish chartVery bullish chart TA speaking, you have a triple bottom and a W shape reversal. You also have a multi year resistance line that we broke out of then performed a throwback retest around $4.80 back in July 2018 before continuing higher.
Using fib extension to anticipate a price movement to $18 around July of 2019 - but I expect a stalling at the high retest of $12.50, then continuation upwards.
