Pretty nice cup and handle on the WRumors are they are going to get bought out: www.reuters.com
Chart says it goes through and this bodes well for NASDAQ:ANSS holders.
regardless the set up is pretty nice.
ANSS trade ideas


Ansys Stock Jumps On Takeover Interest In Simulation Software FMAnsys (ANSS) stock jumped today reports that the maker of engineering simulation software might be a takeover target.
Bloomberg reported late Thursday that Ansys is weighing its options, including a sale, after getting takeover interest.
On Friday afternoon, the Wall Street Journal said Synopsys ( NASDAQ:SNPS ) was in talks to acquire Ansys. The Journal said the talks could still fall apart and another suitor could emerge.
Ansys makes simulation software used by engineers to help predict how products from semiconductors to engines will work in the real world. It serves such industries as aerospace and defense, automotive, energy, health care and industrial equipment.
Potential Bidders For Ansys
Electronic design automation companies like Synopsys and Cadence Design Systems (CDNS) are potential acquirers of Ansys, Wong said.
Other possible buyers include multinational companies such as Siemens (SIEGY), Honeywell (HON) and General Electric (GE), which "have previously shown an appetite for software."
JPMorgan analyst Stephen Tusa said he believes Cadence and Synopsys would be the most likely acquirers. Other potential buyers or merger partners include Autodesk (ADSK) and PTC (PTC), he said.
Ansys has about 20% market share in the fragmented $10 billion simulation and analysis market, Tusa said.

AnSys ANSS is in DCA range: Ai, Big Data, MechanicsThis company is a juggernaut of IP/ software/ Big Cap Tech & manufacturing clients
Buying anywhere near $270 or less will be profitable in a year or two

ANSYS - Probable Head & Shoulder TopAnsys seems to be forming a head and shoulders top.
Left shoulder - 31st March 2023
Head - 18-19th July 2023
Right Shoulder - 6th Sept 2023
Volume details for the key areas (in '000)
i) Left shoulder
15th Feb to 31st March 2023 622.89
7 days leading upto 31st March 2023 550.04
ii) Head
4th May to 19th July 2023 457.50
7 days leading upto 19th July 2023 360.19
iii) Right Shoulder
18th Aug to 6th Sept 2023 394.25
7 days leading upto 6th Sept 2023 397.51
Volume is in line with a tradition H&S top forming pattern.
A breach of the 288.5 level with considerable volume would be a significant move, as it is the top end of the 'Gap up' that was formed on 23rd Feb 2023 (Range was 270 to 288.5). Once 288.5 is breached with a considerable volume, there would be a bearish pressure to fill the gap and that would confimr the H&S top.

ANSS Entry, Volume, Target, Stop, ResistanceEntry: when price clears 333.89
Volume: with daily volume greater than 727k
Target: 386 area
Stop: Depending on your risk tolerance; 316.55 gets you 3/1 Risk/Reward.
Resistance: 347 area, 373 area
This swing trade idea is not trade advice and is strictly based on my ideas and technical analysis. No due diligence or fundamental analysis was performed while evaluating this trade idea. Do not take this trade based on my idea, do not follow anyone blindly, do your own analysis and due diligence. I am not a professional trader.

Unbreaked DeclineThe stock is caught within a Fibonacci trap and has got some momentum today to test the bottom of the cage. As the stock is in overbought condition this test may get more momentum an fall through. We will probably not close the big open February window but a retest of the June lows seems possible without stop. Okay, a breath at the March high is possible.

Outbreak CorrectedWe have seen an outbreak within the trend last week and a test to the downside yesterday. The jump down today has been bought immediately. This indicates a still strong sentiment for this stock.

ANSS ,,, BUY OPPORTINITY UPTREND
its started a new rising after a pullback to a broken level. Buying suggested by setting sl at about 280

ANSS Entry, Volume, Target, StopEnter when price clears 332.80
With daily volume greater than 727k
Target: 356.5 area
Depending on your risk tolerance: 326.35 gets you 3/1 Risk/Reward

ANSS AnSys The Software Simulation Engine For Everything AI Ansys, Inc. is an American company based in Canonsburg, Pennsylvania. It develops and markets CAE/multiphysics engineering simulation software for product design, testing and operation and offers its products and services to customers worldwide.
Opening positions under $220 and attempting to hold for $300

ANSS Symmetric TopDespite already falling 50%, ANSS has merely reversed the blow-off top caused by the 2020 melt-up. The symmetric top is nearly complete. I expect a break will initiate a move to the March 2020 low around the $130s.
Catalyst will be the major indexes breaking to new lows, initiating the first capitulation selling wave of this bear market.

ANSYS new bullish push to see in next periods
Hi viewers, ANSS here stll bullish porgress technically watched in next periods to expect
TP1:284
TP2:294
TP3:301

anss buyansys buy .. buy after the break above the resistance 1 and 200 ma ... finally target tp4 ....

$ANSS with a Bullish outlook following its earnings #Stocks The PEAD projected a Bullish outlook for $ANSS after a Positive over reaction following its earnings release placing the stock in drift B.

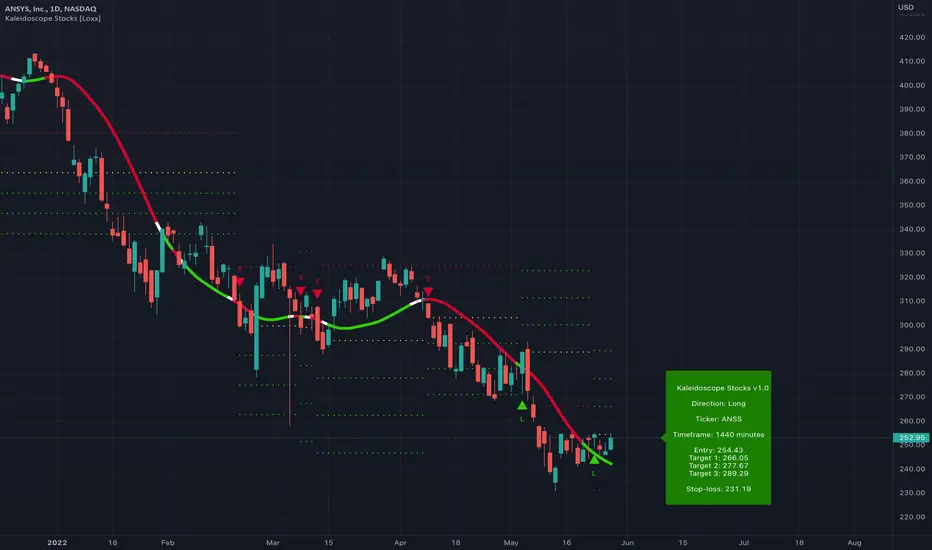
ANSS High-risk Initial LongANSS High-risk Initial Long. SL and TP on the chart. If CFD 10-20x leverage. Move SL on TP.
$ANSS Big Base on a Software Name$ANSS software name with a big base that's looking fantastic.
I am displaying Accum/Dist line below volume instead of my regular OBV. OBV diverging with price Acc/Dist conversion and sitting right below highs.
One to keep eyes on with it holding up this well.


ANSS🌦You know your forecast is on the right track when you start seeing several fractals on lower time frames.

ANSS#ANSS The paper stood in 4 months accumulation and is finally ready to break through to the top (see the yellow circle). There are 2 growth targets - 402.50 and 409.68. But, pay attention to the divergence of the RSI indicator - therefore, it is quite possible that the security will test the local support level (the movement is indicated by the blue line). Also, try to open the chart of this company at TF = 1M, and you will see that the security practically does not allow itself to be bought at a low price, and the current trade is a good opportunity to jump into this asset for a long time, certainly promising.


DAILY ANALYSIS OF ANSYS INC Hi friends
the daily chart of this market shows that it will experience with a high probability an uptrend in the coming days but also we must be vigilant of the change of direction
please subscribe to receive new analyzes

$ANSS On Breakout Alert Alert set for breakout above $298
Indicators bullish and have room to run higher.
Needs a pick up on volume to break resistance
ANSYS, Inc. engages in the development and marketing of engineering simulation software and services. It operates through the following geographical segments: United States; Japan; Germany; South Korea; France; China; Other EMEA; and Other International. The firm's solutions include automotive; aerospace and defense; construction; energy; materials and chemical processing; autonomous engineering; and electrification. The company was founded by John A. Swanson in 1970 and is headquartered in Canonsburg, PA.
