Digital Turbine, Inc. (APPS) Drives Mobile Ad GrowthDigital Turbine, Inc. (APPS) simplifies mobile content delivery by helping app developers and advertisers reach users directly through smartphones. Its platform comes pre-installed on millions of Android devices, allowing brands to promote apps and services more efficiently. The company’s growth is driven by mobile ad demand, partnerships with carriers and OEMs, and the global expansion of mobile device usage.
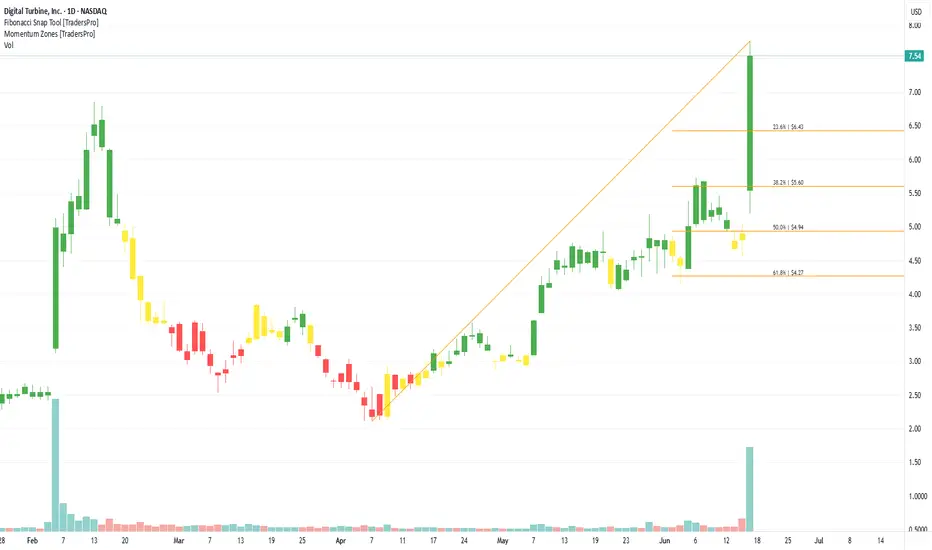
On the chart, a confirmation bar with rising volume shows solid momentum. Price has moved into the momentum zone, breaking above the .236 Fibonacci level. A trailing stop can be set just below that level using the Fibonacci snap tool to protect gains while staying in the trade.
APPS trade ideas
Digital Turbine, Inc. (APPS)As a Whole formation, it looks to me the nearest Scenario is we Completed Major 1st Wave at 102$ , In my opinion as a technical analyst in charts and technical formations, in addition to the corrective formations I have encountered many times before, we have completed the correction of a leg of a major correction for the second large wave at $1.18. We are entering the early stages of the second leg, which I expect 99% will go to its final target at $141 by 2027. However, the closest level in 2025 is $25, and perhaps with significant news like a partnership and investment with major companies, it might hit the target of $49 by early 2026. The correction as a whole is called the minor or accelerating correction A B C.
Target Prices and Expected Periods: -
1 Month = 25$
6 - 9 Months = 49$
12 - 15 Months = 141$
APPS has a High Technical Rating by Nasdaq Dorsey Wright.
Earnings announcement* for APPS - Jun 16, 2025

Digital Turbine inc Ending Diagonal wave, Target prices zone between 6.12$ - 6.30$
Technically has to reach that Zone by Tomorrow.
Stock is a High Ranking by Nasdaq.
Highly recommended for Buying now from present level 👌

Digital Turbine inc. Future of the Stock impressive, where it Target level = 47.57$
Cup and Handle at the Bottom in progress of formation 👌
1st Target price = 47 $ - 48 $
A Motive powerful wave in the way, and I expected a Massive positive News in the way any moment
Highly recommended for Buying & Accumulation.

Digital Turbine inc Inverted Head and Shoulders bottom pattern formed .
Target price = 12 $ - 13$ .
Breaking up level 5.40$ initiate starting up wave 👋

Bullish Turbine to 10x Digital Turbine has completed a multi-year downtrend and recently broken out of its descending channel with conviction, supported by historically high volume (🔶 orange arrow). The breakout above the $3.45–$4.65 range confirms the start of a new bullish cycle.
🔑 Key Technical Highlights:
🔻 Red arrows mark major rejection zones
🟦 Breakout above prior downtrend line and heavy resistance
🟧 Massive volume surge on breakout → institutional accumulation likely.
🟢 Green volume bars show sustained demand post-breakout.
🔵 Blue arrow highlights the key retest of broken resistance, now acting as support
🎯 Bullish Path Forward:
If earnings support the technical structure, price is poised to:
Reclaim $6.12 → target $9.05 (mid-resistance)
Break $9.05 → open the path toward $21 and $32
StopLoss is set at $3.40 . Anything under this level invalidates scenario

Digital Turbine inc. Stock in triggering point now ... it could trigger any moment from now
Target prices on chart near future.
Accumulation in process.

Digital Turbine inc Stock in accumulation zone , triggering zone reached.
Target price 1st = 7 - 9 $
Buying process in progress.
Strike could be any moment.

$NASDAQ:APPS Breaking Out on Massive Volume 73%++ upsideNASDAQ:APPS is breaking out, having closed above the double bottom pattern resistance (at $4.64).
Entry: Any point now. If you want to get it at a more affordable price point, this may retest $4.64.
Price Targets:
$8.06 to complete the Double Bottom pattern 73% upside
$9.91 to complete the Falling Wedge pattern 113% upside

Trade Setup Breakdown for APPS (30-Min Chart)!📊
🔹 Stock: APPS (NASDAQ)
🔹 Timeframe: 30-Min Chart
🔹 Setup Type: Symmetrical Triangle Breakout
🚀 Trade Plan:
✅ Entry Zone: $5.45 - $5.50 (Breakout Confirmation)
✅ Stop-Loss (SL): $5.00 (Below Key Support)
🎯 Take Profit Targets:
📌 TP1: $5.93 (First Resistance)
📌 TP2: $6.51 (Extended Target)
📊 Risk-Reward Ratio Calculation:
📉 Risk (Stop-Loss Distance):
$5.45 - $5.00 = $0.45
📈 Reward to TP1:
$5.93 - $5.45 = $0.48
💰 Risk-Reward Ratio to TP1: 1:1.06
📈 Reward to TP2:
$6.51 - $5.45 = $1.06
💰 Risk-Reward Ratio to TP2: 1:2.35
🔍 Technical Analysis & Strategy:
📌 Breakout Confirmation: Price breaking out of the symmetrical triangle with momentum.
📌 Pattern Formation: Triangle Breakout, signaling potential bullish move.
📊 Key Support & Resistance Levels:
🟢 $5.00 (Support / SL Level)
🟢 $5.45 - $5.50 (Breakout Zone)
🟢 $5.93 (First Profit Target / Resistance)
🟢 $6.51 (Final Target for Momentum Extension)
🚀 Momentum Shift Expected:
If the price sustains above $5.50, we could see a rally towards $5.93 and beyond.
🔥 Trade Execution & Risk Management:
📊 Volume Confirmation: Ensure strong buying volume above $5.50 before entering.
📈 Trailing Stop Strategy: If the price reaches TP1 ($5.93), move SL to $5.50 to protect profits.
💰 Partial Profit Booking Strategy:
✔ Take 50% at $5.93, let the rest run to $6.51.
✔ Adjust Stop-Loss to Break Even ($5.50) after TP1 is hit.
⚠️ Fake Breakout Risk:
If price fails to hold above $5.45, be cautious and avoid entering early.
🚀 Final Thoughts:
✔ Bullish Setup – If price sustains above $5.50, a strong move is expected.
✔ Momentum Shift Possible – Watch for volume increase to confirm the trend.
✔ Favorable Risk-Reward Ratio – 1:1.06 to TP1, 1:2.35 to TP2.
💡 Stick to the plan, manage risk, and trade smart! 🚀🏆
🔗 #StockMarket #APPS #TradingSetup #TechnicalAnalysis #BreakoutTrade #DayTrading #MarketTrends #ProfittoPath

$APPSBreakout it looks like. Can this rise again? Gonna enter in some $5 Feb 21 calls. Check the volume. Big money is flowing here.

$APPS Potential Pumper for EOW Digital Turbine up 22% After-hours post results.
There is a Gap Pivot + 2 Fib GP's in play as resistance.
Worth watching for tomorrow -
👁️$2.90👁️Pullback LOI

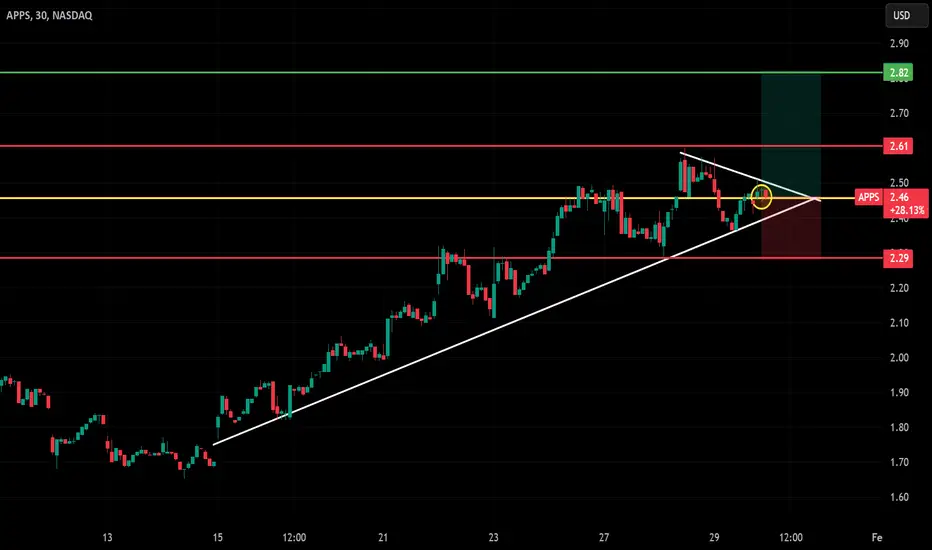
APPS Breakout Trade Setup (30-Min Chart) !📈🔥
📍 #Entry: $2.46 ✅ (Breakout Confirmation)
🔴 #StopLoss (SL): $2.29 ❌ (Support Level Protection)
🎯 #Target1: $2.61 🎯 (First Resistance Level)
🏆 #Target2: $2.82 🚀 (Major Resistance Level – Moon Shot! 🌙)
🔹 #RiskReward: Favorable Setup! 📊
🔹 #Momentum: Strong bullish move 📈
🔹 #BreakoutTrading | #StockMarket | #ProfitToPath
💡 Plan your trade & trade your plan! 🏆💰 Let me know if you need refinements! 🚀

APPS Another bottom feeder but it didn't use to beThis was a monster not to long ago. I read they lost their deal with US cellular I believe and that was the nail in the coffin. There is no way I believe this stock stays down here. If you look at my indicator it has the sauce. Everything is right there for it to take.
If you want to understand the indicator look at the QS Idea.
by iCantw84it
01.02.25

Bullish - "Island Bottem"This stock has been beat down this year due to declining revenue. Who cares about fundamental though?? As you can see from the chart, it has formed a very nice island bottom on the Daily, at what looks to be the end of a downtrend. I entered a long position @ $1.75 with a stop at $1.65.
Top level resistance of the island is @ $1.97. RSI is getting stronger @62, if it can break resistance and support holds at @ $2, I expect this stock to shoot up fast. 1st TP zone is $3.70, 2nd TP zone is $4.20. Easy double up 💰💰

Is trying and is going to make itPrice has tried many tome to break that resistance. Eventually is going to make it. Also looks liken an inverse HS. I opened a long position. Is a very volatile stock so hang tight. SL triggers is a daily candle closes at the level shown. But it has to close.

Digital Turbine Inc. Will break down 1.000 $ .
Targets on chart .
Any break down to the support level 1.41 $ out .

Technical Analysis of Digital Turbine (APPS)Looking at the stock's (APPS) historical performance, we can see a long lateral phase that lasted about 10 years. It broke out of this sideways trend with a strong bullish rally, reaching a peak of around $100. After that, the uptrend ended, and a downward phase began, following the formation of a Double Top technical pattern.
The downtrend appears to have stopped near a support zone.
When zooming in with a lower timeframe, we notice that the downtrend halted around this area. The stock broke a descending trendline and formed a bullish Head and Shoulders pattern. The neckline was broken with strength, accompanied by a substantial increase in volume, coinciding with the release of earnings and revenue reports.
After the strong rally, the stock retraced and is now sitting at the Point of Control (POC) of a key volume area, which considers the entire history of the stock.
Bullish Scenario
The stock seems to be in a rebound phase after touching the POC. A continued upward movement could target the $7 area, which aligns with another significant volume area.
Bearish Scenario
If the POC area fails to hold, one could consider entering at the $1 level, which corresponds to a support area.
Note of Caution: The stock has experienced a massive loss over three years, dropping from $100 to around $1.50. Therefore, it’s crucial to proceed with caution when evaluating this stock.

APPS - Signs of a big reversal?Digital Turbine Inc is an independent mobile growth platform. It offers end-to-end products and solutions to all participants in the mobile application ecosystem, enabling brand discovery and advertising, user acquisition and engagement, and operational efficiency for advertisers. Its operating segments are On Device Solutions and App Growth Platform.
Shares float: 86.431M
Surprisingly good ER from August 7, 2024
We've recently witnessed a significant overextended breakout, and there's potential for a pullback to the 2.60 zone, which could present an ideal entry point.
Breakout Zone: $3.70
Action: If the stock breaks above this area with strong volume, it might signal a continuation of the upward trend.
Overall Market Sentiment:
Currently, the market seems to be in a correction phase. It’s crucial to consider this sentiment when making trading decisions.
Resistance Points:
$3.70
$4.50
$5.10
$6.00
$7.40
$9.20
Surpassing these levels could signal a positive trend. Consider taking profits at these stages to realize gains.
Trading Strategy:
Take Profit (TP): Set a target at $10.00
Stop Loss (SL): Set at under $2.40 to mitigate potential losses.
Chart Analysis:
Please refer to the attached chart for detailed analysis of price trends and movements.
Trading Advisory:
Exercise caution and consider market conditions and your own risk tolerance when trading. It's advisable to conduct comprehensive research or consult with a financial advisor before engaging in trading activities.
Disclaimer: This content is for informational purposes only and should not be considered financial advice.

APPS completing a cup and handle formation APPS is about to complete a cup and handle formation. Confirmation at the break of $2.49. TP at $3.54. 🚀
Bullish signals supporting short term positive momentum of APPS:
- Price broke the descending parallel channel
- Price is above EMA 20 and EMA 50
- EMA 20 crossed EMA 50 upwards
- RSI is very bullish but not in overbought territory
- Higher highs and higher lows since 20th June 2024

5/28/24 - $apps - find another parking spot, don't like this one5/28/24 - vrockstar - NASDAQ:APPS - don't think much changes from my prior (non-public) comment heading into the last print in Feb. the capital stack is basically the main problem here. massive short interest at 8 DTC keeps this think probably moving pretty dramatically one way or another. but given the size of the company and the impending AI disruption generally, this would seem to probably be a lower hanging fruit sooner than later for competition. while you could claim they'll adapt... this is much easier said than done to retrofit your org to becoming AI-centric. i'd probably just stay away from this period unless you have a much more nuanced POV. gl to the holders, but you may want to find another parking spot for your capital.

on watch for a big rally 🤔🔭APPS is breaking this extreme downtrend resistance that has held for over a year! we have seen a few fake out breakouts recently so I would like to see weekly outlook before I take any shares or options here.
potential for a 600%+ rally from here... boost and follow for more! thanks ❤️🔥
