ARCT is in the half way to its rapid gain pointNASDAQ:ARCT might rhyme its path in '19-'20 yrs
Now ARCT accumulating its power to the rapid jump in the middle of 2024.
Be aware, there was a drawdown in the end of '20's accumulation.
ARCT trade ideas

Arcturus testing ICE and 3 other lines from above - BULLISH
Here we see a test of an absorbtion. The test is were 4 lines come together. One of them is an ice line and the line were bearish absorption ttok place and was absorbed by bulls. This one is very very bullish. It can take time, but it will go up very fast. This is more likely. But be careful, if the channel is left to the downside, it will we the oposite, so very bearish. Allways put StopLosses below absorbtion chanels like this one - 5 % below would be good.

Bought a small pilot position in ARCTNASDAQ:ARCT prices gapped up on strong volume (10x the average) during the previous earnings before moving up to the $28 resistance level. The $28 price level served as resistance previously back during feb and april of last year so it was not surprising to see prices encountered resistance at that level. Prices moved sideways more or less at the top right side of the 1 year 3 months long base before it declined and undercut the pivot low of roughly $27. However, prices managed to find support at the 21EMA (green line). This is a positive sign that the stock is finding support. Prices formed a cheat entry but I missed out on the day of the breakout and only entered my position the day after (8 may).
While the entry was not right at the breakout level, i compensated it by taking a smaller than usual position in NASDAQ:ARCT due to its positive technical action. As the stock has moved up and above 1R, i have moved my stop loss to the entry price which gives me a free trade from here on. This means that even if prices move against me (as long as it does not gapped down which is a possibility), i'll breakeven on the trade. But if the stock moves up, I will be able to benefit from the upside. So i'm essentially taking on a risk free trade now.

Long ARCTARCT has been holding steady at a solid support level and it’s primed and ready to make a run for it. There’s an inverse head and shoulders pattern that is showing flashes of a reversal. The green candle close above this channel is also confirming a breakout. Finally, we also have a strong bullish divergence indicating that ARCT is going to break out of its descending channel pattern. I’m targeting the .618 Fibonacci level and I'm feeling confident enough to place a call for $20.
This chart based off of The Elliot Wave Theory, Fibonacci, EMA’s, MacD , RSI , Momentum, and resistance/support zones combined with patterns.

ARCT looks bullishGood company with new technology - Seems like we finally have hit the floor, now ready for a bullish move to the upside.

Short $ARCT Arcturus Therapeutics I will be shorting Arcturus Therapeutics to a range of $10-$12, and exit there.

$ARCT is a BUY nowArcturus Therapeutics Holdings Inc. $ARCT is set to be EBITDA positive in 2022 with a massive change in its revenue from 24.05M in 2021 to 326.44M in 2022. This is 12.57x increase in revenue. These numbers are estimates, but even with a large error margin we should see a drastic change in the price. Moreover, the decline from ATH was 80% and the price has been in a sideways movement after it bottomed. With today's strong breakout of the descending channel, I am expecting the price to start its rise up to the upper band of the range-bound around $63. The long-term targets should be a lot higher.
The breakout setup entry provides us with an awesome +3 Reward/Risk. A tighter stop loss order can even make it a lot better. A late entry at current prices provides 1.8-2.0 which is still a good ratio.
BioTech stocks are risky and volatile. This is not financial advice. DYODD

Potential Wyckoff Accumulation on $ARCTfinal charted thesis with considerable help from Wyckoff specialist @WyckoffOnCrypto

Possible Wyckoff Accumulation on $ARCTI have been trying to identify and study the Wyckoff patterns ever since the pattern became recognized in the recent bitcoin distribution and accumulation phases. i believe i see accumulation in $ARCT, which is a biotech with mRNA vaccines and treatments. The stock is lower float, heavily shorted, and with current issues surrounding Covid-19, a potential runner. There are several gaps to fill above as well and earnings coming up shortly, with a potential to surprise to the upside.


ARCT Breakout SetupMonthly candle right around historical S+R, a monthly and or weekly close above $34.50 takes ARCT to $44ish. Could be fire

ARCTcumulationBacktest + clean bounce off last year's gap up breakout. Oversold and ready for reversal, very fire


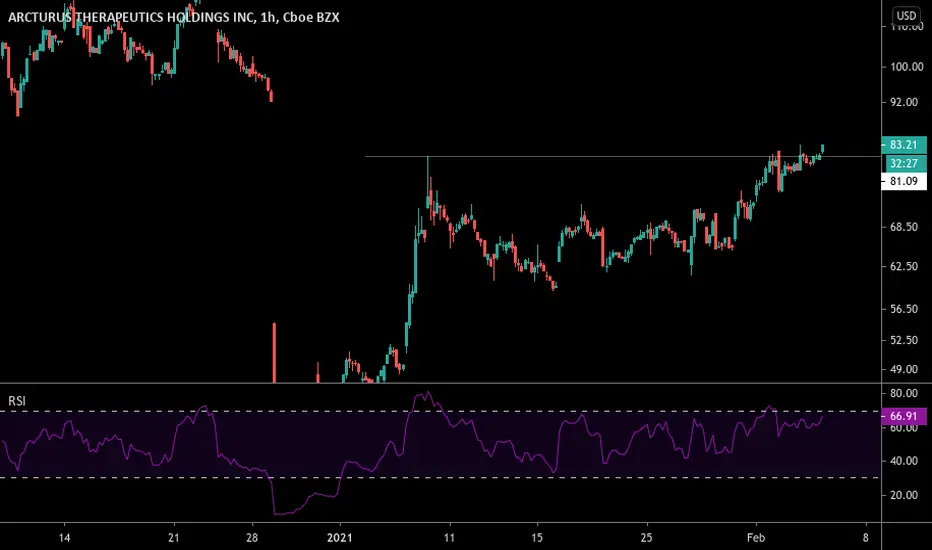


ARCT - First target hit and now we look for close above $61 This can still run more if we close above $61 look for next target to $77 then $85


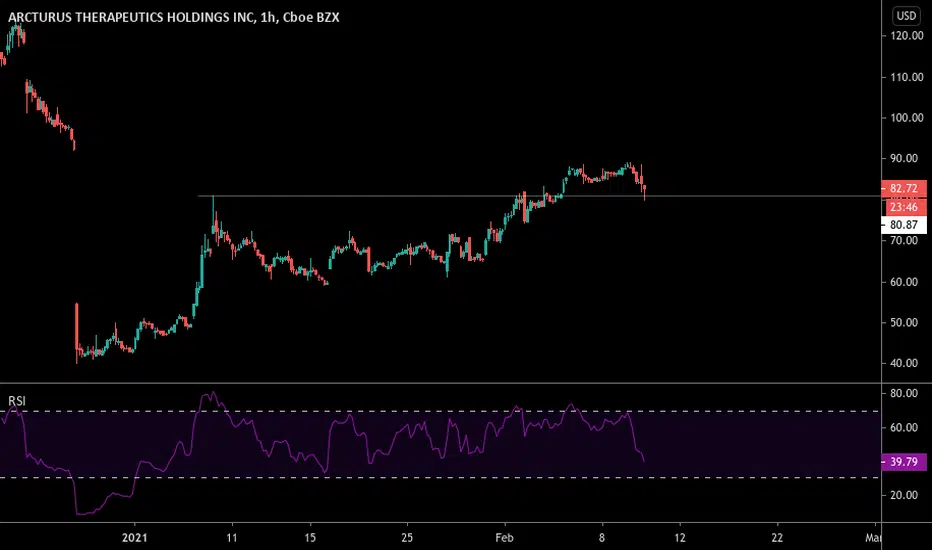
trend channels dont lie ! great dip entry here! RSI is telling us this is the perfect dip entry ! long at at 49 with stop loss at 42, price target 80-100 if you are patient with the swing! good risk reward, doesnt get much better than this imo! goodluck as always longs :)

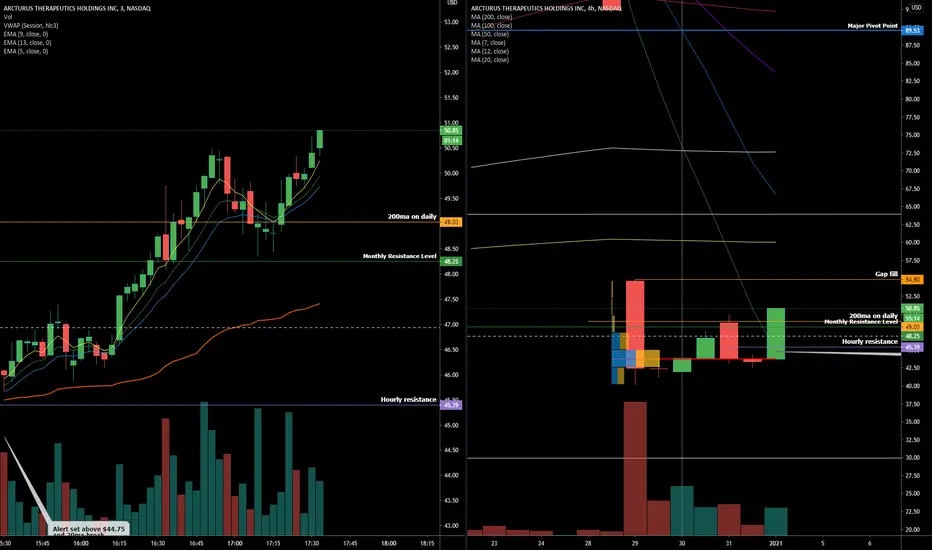
$ARCT Arcturus Therapeutics Reversal To Gap
We nailed the reversal on previous post so now we have broken through the 200ma,
we are looking at the gap fill as next target $54.80
This is a ripper so be careful , SL in place