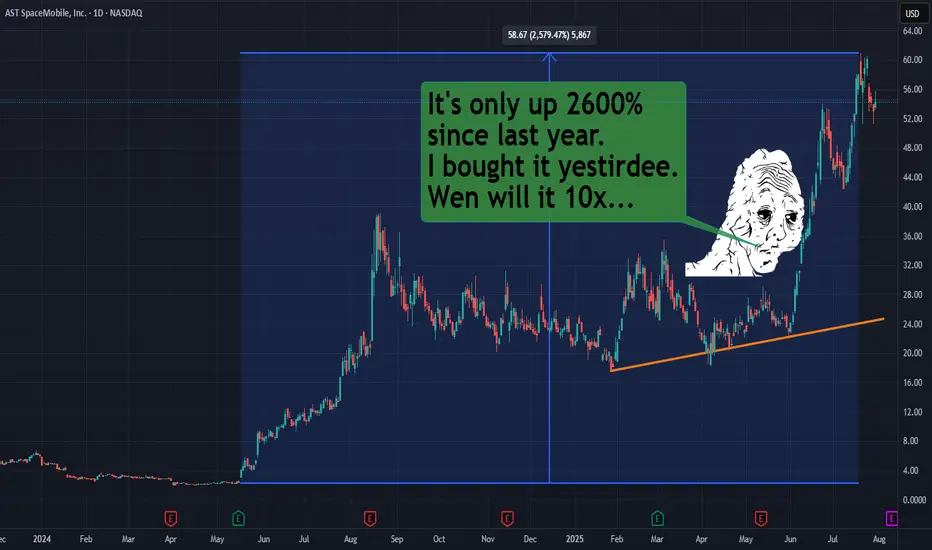
ASTS | Starlink ain't the only game in space no mo!This stock NASDAQ:ASTS is only up like 2600% in a year. That's like nothing. Might as well be losing that paypah.
Yes, it will swing more wildly than a chimpanzee from a vine. And yes my chart is probably effed as heck, but I'm looking for beyondosphere type of returns.
Is there room for mo
Next report date
—
Report period
—
EPS estimate
—
Revenue estimate
—
−2.00 USD
−300.08 M USD
4.42 M USD
188.03 M
About AST SpaceMobile, Inc.
Sector
Industry
CEO
Abel Avellan
Website
Headquarters
Midland
Founded
2017
FIGI
BBG00Q402TR2
AST Spacemobile, Inc. engages in building a broadband cellular network in space to operate directly with standard, unmodified mobile devices based on an extensive IP and patent portfolio. It focuses on providing mobile broadband services with global coverage to all end-users, without the need to purchase special equipment. The company was founded by Abel Avellan on May 31, 2017 and is headquartered in Midland, TX.
Related stocks
In spaceA space economy company providing communication services through satellite networks.
The space economy is set to explode over the coming years—it’s a good time to start following a few stocks.
The entire space sector is already experiencing strong growth; companies like Rocket Lab have quadrupled
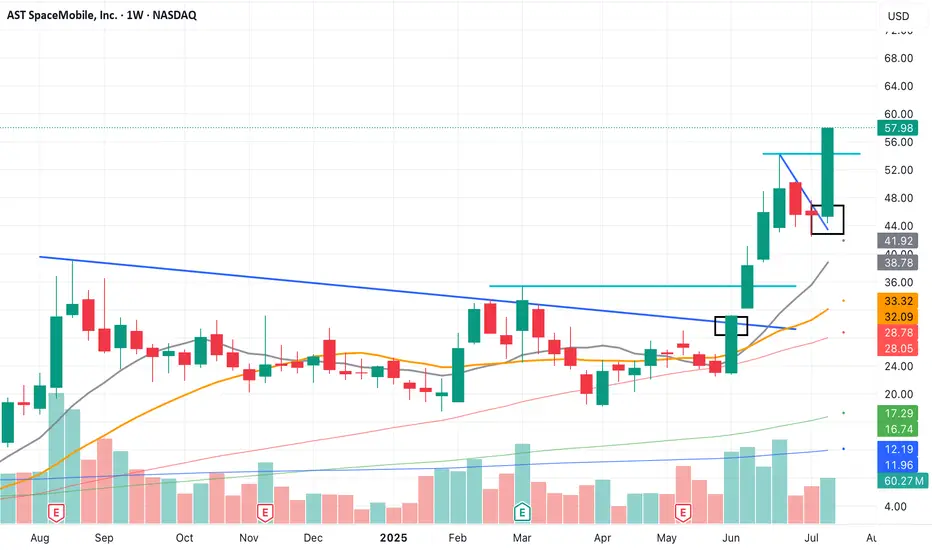
$ASTS possible cup and handle NASDAQ:ASTS
Appears a cup and handle is forming, waiting for the handle for confirmation.
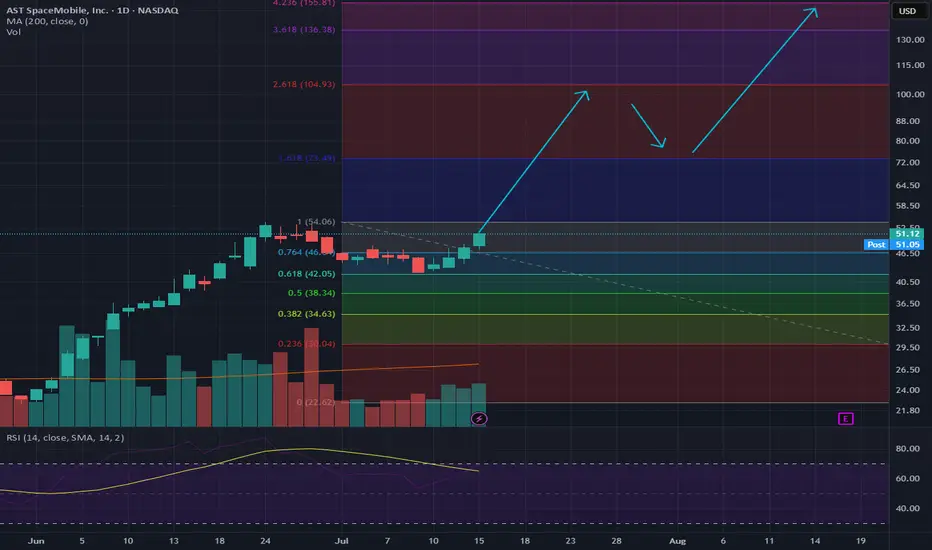
LONG-TERM $ASTSYou can't spell Sats without ASTS
This will be a trillion dollar company - here's the next few years, cheers!
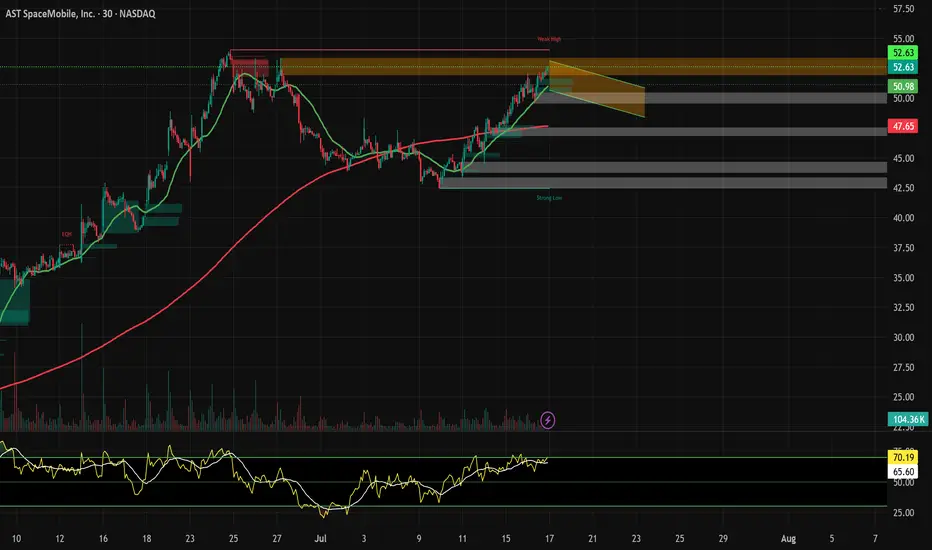
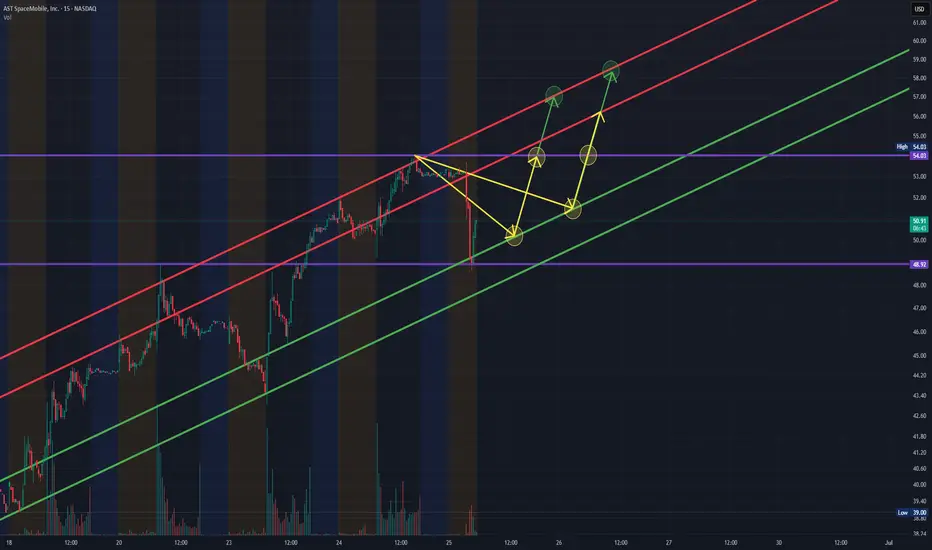
ASTS massive daily bull flagWith the cult like following on this ticker, a 4H break out and hold of this bull flag to the upside could see massive retail money piling in to send the price back to $54 ATH. RSI is also showing potential bullish confluence. The 4H chart has daily EMAs overlayed. The price is currently sitting abo

Quick View : $ASTSThe daily sees a test of the average EMA21 while the hourly tf already shows up a bullish crossover .
Looking for a new high above that level

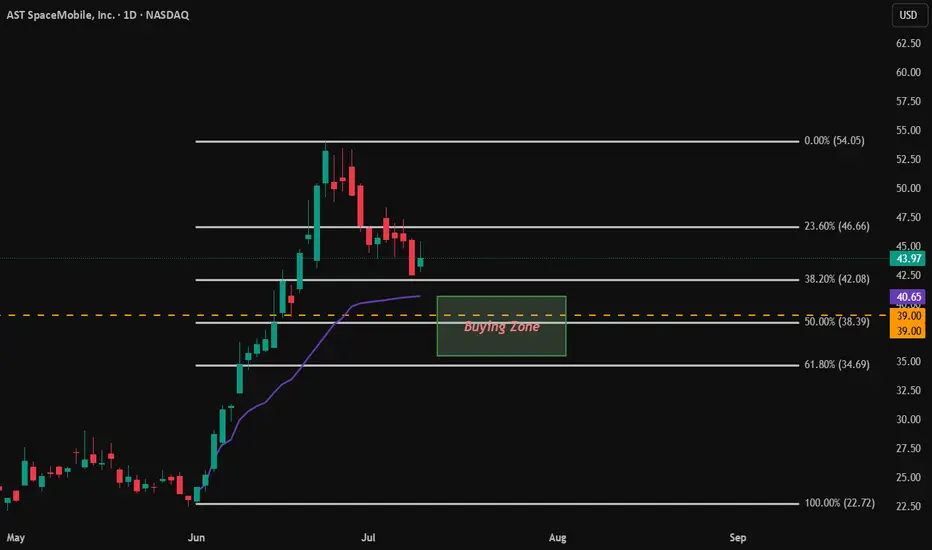
$ASTS Buying the dip. [Long]
Previous bull runs with 50.0% - 61.8% retracements each time.
Stock is still overvalued.
RSI on weekly and monthly confirm this.
50 SMA is still above 200 SMA, and better retracement will be healthy for a stronger bull run continuation.
Buying Zone: $35.50 - $40.65.
Key Levels and points
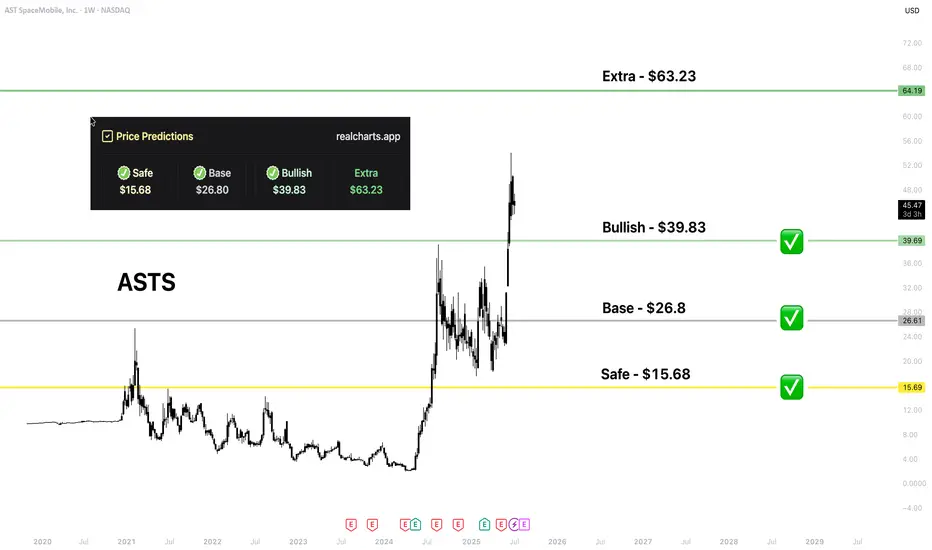
ASTS | Price PredictionNASDAQ:ASTS already hit 3 of 4 targets based on my platform. Massive upside, great asset!
ASTS - Buying Opportunity on ConsolidationASTS set an ATH yesterday (6/25/25) and has consolidated in the pre-market, allowing for anyone who may have missed the stock's run off of those $48.92 Resistance Levels, which have also reversed and turned in support in today's pre-market sessions.
The dip in the stock in this morning's pre-market
$ASTS Short PositionOvervaluation confirmed by RSI indicator.
Massive Doji, signaling pressure and resistance from sellers.
Entry Point: $45.94 (Last daily candle close price)
Stop/Loss: $52.25
Target Profit Price: $35.50
Disclaimer: Charting is strictly for personal analysis, and should not be used for financial ad

See all ideas
Summarizing what the indicators are suggesting.
Neutral
SellBuy
Strong sellStrong buy
Strong sellSellNeutralBuyStrong buy
Neutral
SellBuy
Strong sellStrong buy
Strong sellSellNeutralBuyStrong buy
Neutral
SellBuy
Strong sellStrong buy
Strong sellSellNeutralBuyStrong buy
An aggregate view of professional's ratings.
Neutral
SellBuy
Strong sellStrong buy
Strong sellSellNeutralBuyStrong buy
Neutral
SellBuy
Strong sellStrong buy
Strong sellSellNeutralBuyStrong buy
Neutral
SellBuy
Strong sellStrong buy
Strong sellSellNeutralBuyStrong buy
Displays a symbol's price movements over previous years to identify recurring trends.
Curated watchlists where ASTS is featured.

Frequently Asked Questions
The current price of ASTS is 53.17 USD — it has decreased by −2.06% in the past 24 hours. Watch AST SpaceMobile, Inc. stock price performance more closely on the chart.
Depending on the exchange, the stock ticker may vary. For instance, on NASDAQ exchange AST SpaceMobile, Inc. stocks are traded under the ticker ASTS.
ASTS stock has fallen by −9.76% compared to the previous week, the month change is a 14.34% rise, over the last year AST SpaceMobile, Inc. has showed a 197.21% increase.
We've gathered analysts' opinions on AST SpaceMobile, Inc. future price: according to them, ASTS price has a max estimate of 64.00 USD and a min estimate of 30.00 USD. Watch ASTS chart and read a more detailed AST SpaceMobile, Inc. stock forecast: see what analysts think of AST SpaceMobile, Inc. and suggest that you do with its stocks.
ASTS reached its all-time high on Jul 21, 2025 with the price of 60.95 USD, and its all-time low was 1.97 USD and was reached on Apr 2, 2024. View more price dynamics on ASTS chart.
See other stocks reaching their highest and lowest prices.
See other stocks reaching their highest and lowest prices.
ASTS stock is 4.80% volatile and has beta coefficient of 1.73. Track AST SpaceMobile, Inc. stock price on the chart and check out the list of the most volatile stocks — is AST SpaceMobile, Inc. there?
Today AST SpaceMobile, Inc. has the market capitalization of 13.51 B, it has increased by 19.70% over the last week.
Yes, you can track AST SpaceMobile, Inc. financials in yearly and quarterly reports right on TradingView.
AST SpaceMobile, Inc. is going to release the next earnings report on Aug 11, 2025. Keep track of upcoming events with our Earnings Calendar.
ASTS earnings for the last quarter are −0.20 USD per share, whereas the estimation was −0.19 USD resulting in a −3.12% surprise. The estimated earnings for the next quarter are −0.19 USD per share. See more details about AST SpaceMobile, Inc. earnings.
AST SpaceMobile, Inc. revenue for the last quarter amounts to 718.00 K USD, despite the estimated figure of 4.04 M USD. In the next quarter, revenue is expected to reach 6.68 M USD.
ASTS net income for the last quarter is −45.71 M USD, while the quarter before that showed −35.86 M USD of net income which accounts for −27.47% change. Track more AST SpaceMobile, Inc. financial stats to get the full picture.
No, ASTS doesn't pay any dividends to its shareholders. But don't worry, we've prepared a list of high-dividend stocks for you.
As of Aug 1, 2025, the company has 578 employees. See our rating of the largest employees — is AST SpaceMobile, Inc. on this list?
EBITDA measures a company's operating performance, its growth signifies an improvement in the efficiency of a company. AST SpaceMobile, Inc. EBITDA is −195.87 M USD, and current EBITDA margin is −4.06 K%. See more stats in AST SpaceMobile, Inc. financial statements.
Like other stocks, ASTS shares are traded on stock exchanges, e.g. Nasdaq, Nyse, Euronext, and the easiest way to buy them is through an online stock broker. To do this, you need to open an account and follow a broker's procedures, then start trading. You can trade AST SpaceMobile, Inc. stock right from TradingView charts — choose your broker and connect to your account.
Investing in stocks requires a comprehensive research: you should carefully study all the available data, e.g. company's financials, related news, and its technical analysis. So AST SpaceMobile, Inc. technincal analysis shows the buy rating today, and its 1 week rating is buy. Since market conditions are prone to changes, it's worth looking a bit further into the future — according to the 1 month rating AST SpaceMobile, Inc. stock shows the strong buy signal. See more of AST SpaceMobile, Inc. technicals for a more comprehensive analysis.
If you're still not sure, try looking for inspiration in our curated watchlists.
If you're still not sure, try looking for inspiration in our curated watchlists.