ASYS - Indecisive Channel Channel is moving completely sideways and has been since first listing
showing the bull and bear periods
Monthly chart so price could lead to a long term break out potentially, it may take some time although
ASYS trade ideas


Big boy gains on Asysso this came across my scanner and it's hitting a line of resistance and it's hitting the channel line. It's a pretty volatile stock so I'm thinking it will move a lot. I have a good feeling about it. buy at your own discretion. also with this really it's hitting its second peak.

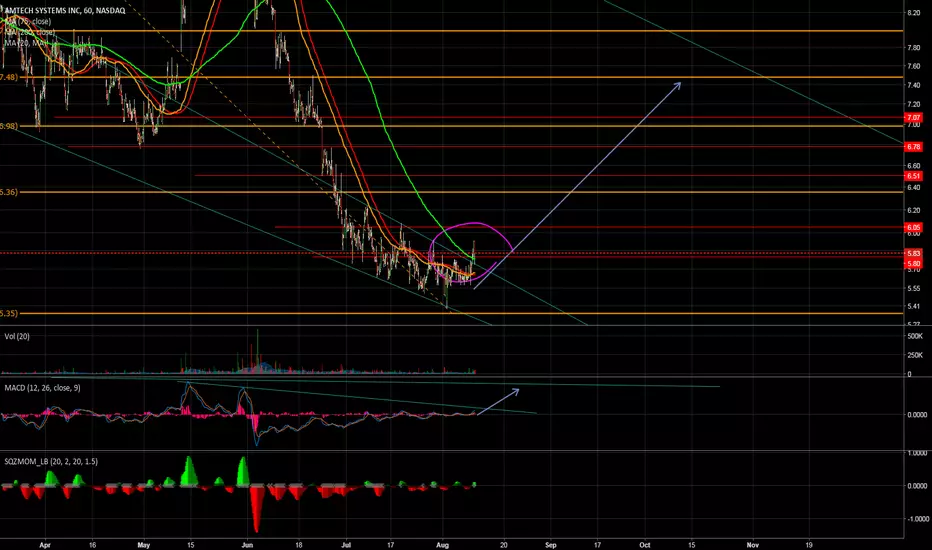
ASYS Holy Grail Setup My Opinion:
Strong Gap Up after positive (surprise) earnings.
I hope to see another strong green day towards $12.
Then, I will watch for sell off and consolidation on 20EMA for entry.
Thoughts?

ASYS break into new channelASYS has broken through a support line and should start trading in a new channel.


Squeeze into EarningsThis is an interesting play. ASYS has been consolidating between 4.00 and 6.00 since mid-2018. It hasn't seen tracked the gains to solar and semis so far in 2019. The weekly chart shows a double bottom at 4.00, rising relative strength and a PMO crossover with a bull kiss to boot. The squeeze has been building on the weekly chart since mid-November 2018.
The daily chart shows consolidation since July 2018, an active squeeze on the verge of firing, and higher highs/higher lows on both RSX and PMO. On both charts, you can see where it's trying to break out of the descending wedge pattern.
ER conference call is set for Feb. 7. Improved performance or guidance would likely release the squeeze. If ASYS breaks 6.00, there's not much resistance until it reaches 8.50 and then 10.00. Any pullback before earnings also presents a buying opportunity. There's no technical support below the floor around 4.00. A selloff below this mark might trigger a free-fall, so watch closely. On the other hand, if support is retested and holds, watch for a strong bounce.
Disclaimer: This is only opinion. This is not investment advice. You are responsible for your own trades and conducting your own due diligence.

ASYS 2 Year Cycle, Need little Small CapFew trend lines put it in perspective. What's your R:R?
3:1?
www.gurufocus.com

Bull wedge ASYSI usually prefer them to develop over twice this time, but the volume and price action looks pretty good.

ASYS Detected possible stock repurchase!!!ASYS: amtech systems inc
2018-04-02 08:30:10
Detected possible stock repurchase


ASYS Double Bottom Reversal NASDAQ:ASYS double bottom reversal. It saw support at this level in July, August, and late January. It saw resistance at this level in mid November so i think its a significant support level. Volume has completely dried out which leads me to believe selling pressure has died out. Its right at its 65 day moving average and could see support and bounce off of there. MACD is close to crossing over, Price Oscillator is slowly diverging from its moving average. Its seeing resistance at its Average True Range a breakout above that is a buy signal. Stop loss is set at 5.29.

ASYS - Possible flag formation Day trade from $5.20 to $6.87ASYS is a possible flag formation. Very speculative trade, seems there was some promotion or some major news. We would be very cautious & most probably it will be a day trade.
* Trade Criteria *
Date first found- January 25, 2017
Pattern/Why- Possible flag formation, Day trade
Entry Target Criteria- Break of $5.20
Exit Target Criteria- First target $6.17, Second target $6.87
Stop Loss Criteria- $4.77
(Note: Trade update is delayed here.)

