ATER PharmaATER has traded down to a support level and 0.62 Fib retracement. ATER has an upcoming pharmaceutical approval from the FDA for one of their drugs which remains in stage 2 trials.
ATER trade ideas

Aterian, Inc. (ATER) bullish trendlineAterian was named 166th fastest growing company in Americas by Financial Times.
A expect a retracement to the 0.618 Fibonacci level before another leg up.
My price target is $9.30.
Looking forward to read your opinion about it.

$ATER #ATER MA200 Breakout Soon?How high can $ATER fly when it breaks out its 200 day moving average? Follow me for trading ideas!

lots of rejection at trend resistance looking for dip entries near local/extreme support.
downside targets are 4.52-3.46-2.4

Day 3 Long ATERATER has been a ticker in play ever since the 4th of April when it pulled a 1st Green day and has held key levels ever since then. Today's play resembles very much to the run it made a week ago after holding key levels and squeezing its way to new highs.
Psychology behind players:
1. Shorts - Shorts holding from the first green day highs expecting way lower prices. Day 2's (yesterday) action towards EOD prolly gave them more confidence to hold their positions for longer.
2. Longs lost an important level 4.15-4.20 on day 2 towards EOD but play was clean nonetheless and had not retrace more than 50% off the highs from the initial run = still bullish and even more so when on day 3 consolidated all thru morning above the lost level on the prior day.
My guide for entries were holding of VWAP level and soaking price action above and below 4-15-4-20 level. And when it was breaking to new HOD added a small piece.


Aterian Long Hold TradeAterian Long Hold Trade
TECHNICAL RELEVANCE:
RSI Bounce From Oversold Levels
MACD Bullish Momentum On Long Term
Bullish Divergence With Price & Indicators
Increasing Volume Candles With A Recent Spike
Strong Breakout Having 100% Gains In One Week
Recovering Lost Value During USD Value Increase
Convergence With Trendlines To Ultimate Target
TARGETS:
$7.77 Magic Number
$12.00 Golden Range
$19.00 Fibonacci Extension
$30.00 Bullish Confluence

Ater Weekly Chart looking goodBeen following ATER weekly chart for a run up, and looks its about to go!!


NASDAQ:ATER LONG Weeklyfor $ATER RSI on weekly looks bullish after reaching the base , RSI on weekly show divergence , potential to exit the short trend after breaking the orange line, all will depend on the Tuesday March 7 2022 Call
asking price now @ $2.29

$ATER => WatchlistMaybe Aterian deserves a spot on a trader's watchlist here. Above 4$, crazy things COULD happen.
Those 2021 highs most likely won't be seen any time soon if ever again, but already a mild retrace to the 23 or 38 retraces would mean big gains.
A break above 4$ and closing above it at least on daily timeframe is mandatory here though, for putting some money on line in my opinion.
Good Luck on your trading!


$ATER Aterian Inc. LONG TRADE SETUP$ATER Aterian Inc. Swingtrade chance.
Pretty low risk, but very high reward in my opinion.
The play here is a double bottom pattern, market has set up the bottom higher than it has in August. The price marked up intensely in August, after the bottom was in.
One would stop out the current bottom, but give it a little room to breathe, Aterian is something else, when it comes to volatility .
We got some kind of bullish divergence in the daily chart as well, but don't give that too much value tbh, if that kind of stock want's to tank, it just does, no matter what the indikators say.
BUY IN: now (or wait for confirmation candle if you want it more "safe")
Stop: 5.60ish
TP's as in the chart (keep a small portion of your position though after TP4, if the stock decides to go to mars)
Super volatile and risky play, but big upside, i think thats a stock to own, when we get really FOMOy in the Nasdaq,
when (or if) christmas rallye really kicks in.

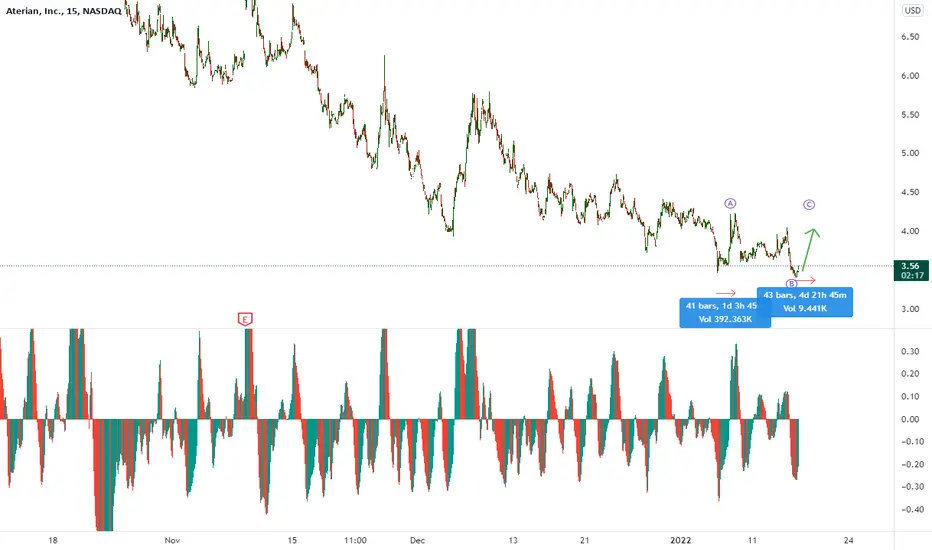
Ater Harmonics: Long IdeaOne may still pick up an entry around 6.26-6.27 around here while price is accumulating orders around this level. There appears to be a bat pattern leading to the first harmonic area; followed by a crab pattern, the main harmonic in play in this 4 hour time frame. Once the bat pattern completes, there will likely be a 0.5 retracement of the move. Then we can see sustained pressure of the crab pattern to completion. The crab pattern harmonic was barely outside the range for a gartley pattern; therefore, we must assume we are dealing with a crab. Anyway. There isn't much drawdown potential in this area so I would suggest an entry around here and continued accumulation if price does drawdown because there is a much larger harmonic at work which is threatening to move price up to the 40s. Good luck, trade safely, and let's make that money!
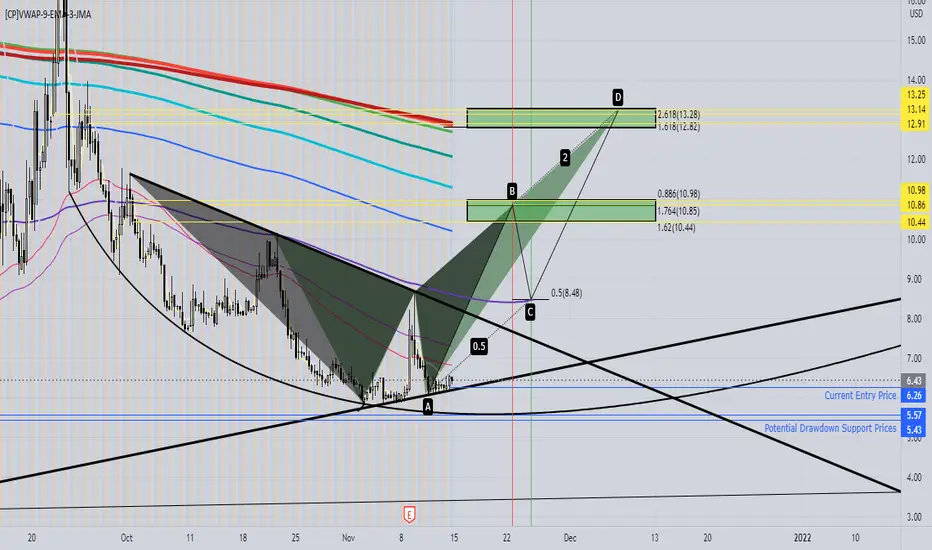

Ater Harmonics: New Entry Point This will be a long hold with multi-bagging potential. The larger picture shows possible resistance price targets of around $30 and $40, but this is a long hold. Anyway. The entry here is at 6.15 exactly. I recommend taking entry one or two pennies higher. Potentially price could fail at the 6.15/16 level and find support and the 1.13 extension; however, the trend line would be violated so I expect other buyers to see this and pile in, keeping price from closing below the trendline. If price spikes below the trendline, have an order at the 1.13 extension, one penny higher. Set a stop at 5% and wait. Good luck, trade safely, and let's make that money!

ATER might be developing a B wabe of and ABC correction.It looks like to me that ATER is currently developing a C wave to end the B wave of the ABC correction. This C wave should have 5 internal waves that could lead the price to at leas 1,43 $ . It can't be ruled out a possible move deeper to 1,21 $ (100% Fibonacci Extension of the Zig-Zag forming B wave) and even testing 0,37 $ (-1.382 Fibonacci Retracement of A) to from and Expanding Flat.

$ATERFalling wedge at a demand area.
Hidden bullish divergence developing on the daily MACD.
Stop = Close below demand area $5.80
1st Target = The low of the previous low of the downtrend. Around the $7.60’s
2nd Target = Gap fill

$ATERFalling wedge pattern, as well as a bullish gartley harmonic pattern with the PCZ on a historical S/R level .
On the 4H chart we have developing classic bullish divergence , and on the 1D chart we have hidden bullish divergence developing.
Confirmation of these divergences will be my sign to enter this trade.

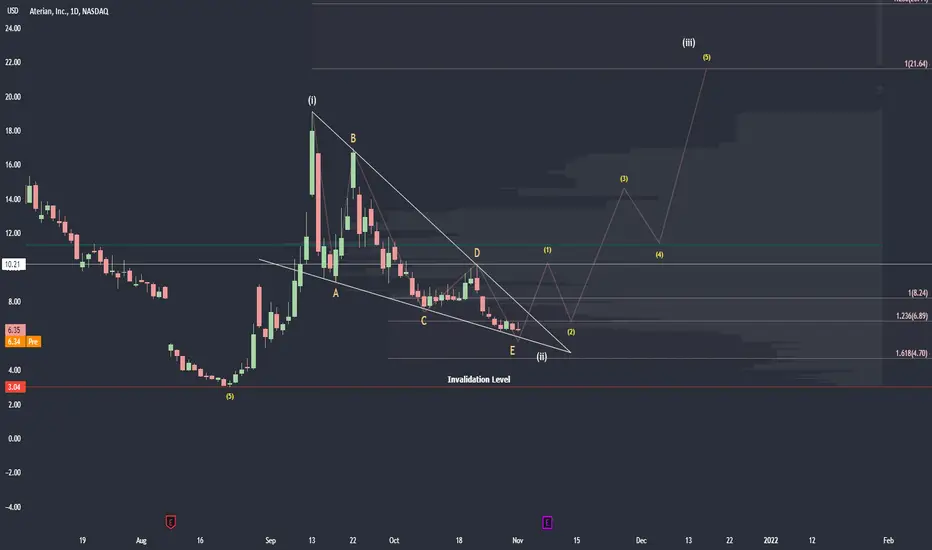
ATER - Keep an Eye on this One!ATER - We had a nice reversal into an impulse Wave 1 move from $3.04 -> $19.10 and since then, ATER has pulled back into it's W2 correction within this falling wedge. It is nearing the APEX (Nov 12 but could breakout anytime now). Current resistance is $6.89 and next support at $5.70 then $4.70.
Keep an eye on this one as a break above $6.89 can send this straight towards $6.89 and potentially $8.24. We're now waiting to see that impulse move for a micro W1 to begin what is expected to be a minor W3 towards $21.
$3.04 is the W1 low and is the invalidation level. If ATER breaks below this, the pattern and wave count is broken.
ATER still has an extreme high short float at 55.43% according to Finviz
ATER | SHORT NASDAQ:ATER
Last session they broke the trend, and bears are in full control of the stock, it looks very bearish and I expect it going down to 6.30$ area as Max Pain,
It formed a falling wedge. end of the wedge we can expect a break-out, it takes some time, maybe a week.
Mid Term Bullish
Short Term Bearish
IT TRIGGERED these bearish signals
P&F Descending Triple Bottom Breakdown
Stocks in a New Downtrend (Aroon)
Moved Below Lower Price Channel
Elder Bar Turned Red
Parabolic SAR Sell Signals
*This is my idea and could be wrong 100%
