ATOS trade ideas

Long | ATOS | week end 30 July 2021NASDAQ:ATOS
Possible Scenario: LONG
Evidence: Price Action
TP1: 5.30
This is my idea and could be wrong 100%, not a buy/hold/sell signal.

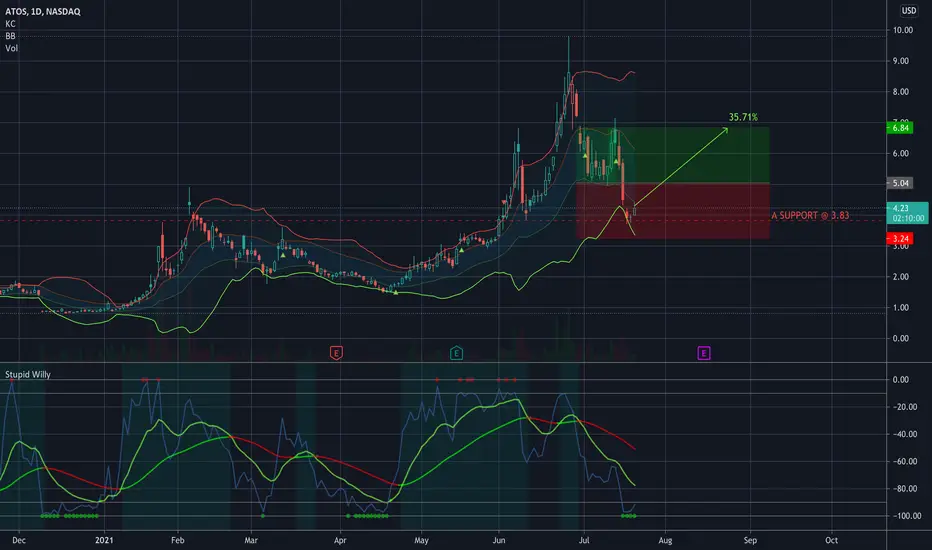
ADDED to $ATOS Target 6.84 for 35.71% 🟢 $ATOS Target 6.84 for 35.71%
This one was caught by support so I added… I’ll add again at support if it goes that way… And if it breaks below I’ll double at 3.24
-----
—
On the far right of the chart is my Average (Grey) Current Target (Green), and Next Level to add (Red) Percentage to target is from my average.
Numbers with an A are places that are a good idea to add if you can.
Numbers with a D are places where you should double your position.
I start every position with .5 - 1% of my account and build from there as needed and as possible.
I am not your financial advisor. Watch my setups first before you jump in… My trade set ups work very well and they are for my personal reference and if you decide to trade them you do so at your own risk. I will gladly answer questions to the best of my knowledge but ultimately the risk is on you. I will update targets as needed.
GL and happy trading.

$ATOS worst case scenario (hopefully)This idea is largely inspired by @shkspr who predicted the head and shoulders pattern well before it manifested.
The large upwards trade channel is what I have been using to base most my trades off.
A classic head and shoulders pattern, when it fully realizes, can drop by as much as the pink arrows indicate. I consider the top part of the Head to be an abnormality and therefore have kept the height of the Head within the upwards channel. In a textbook scenario, this would mean that we might get close to $2-$2.50 again. This range also aligns with the lower upwards trend which the second pink arrow touches.
Good news might cause a reversal or even price spike.

ATOS | InformativeNASDAQ:ATOS
Following my previous ideas that you have access below this page, it hit my first price target, this is what I see and expect from the chart. lets see how it works.
it can drop from this price without filling the gap, but possibility of filing gap us much more. GL
*This is my idea and could be wrong 100%, this is not a BUY/SELL/HOLD signal.


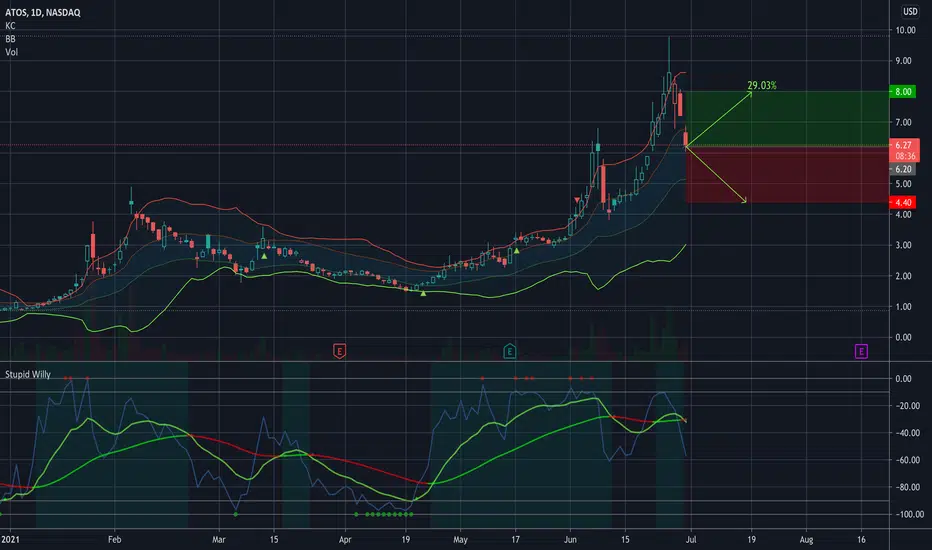
🟢 $ATOS Target 8.00 for 29.03% 🟢 $ATOS Target 8.00 for 29.03%
Or double position at 4.40
Check chart for additional add levels…
—
On the far right of the chart is my Average (Grey) Current Target (Green), and Next Level to add (Red) Percentage to target is from my average.
I start every position with 1% of my account and build from there as needed and as possible.
I am not your financial advisor. Watch my setups first before you jump in… My trade set ups work very well and they are for my personal reference and if you decide to trade them you do so at your own risk. I will gladly answer questions to the best of my knowledge but ultimately the risk is on you. I will update targets as needed.
GL and happy trading.
I finally added my YouTube Training Video to my profile tagline since I’m not allowed to on here. It’s a quick 15 minute training video on how to set up your chart and how to spot opportunities. So check here first but If you have questions just message me.
If you understand options at all I’m trying to learn so shoot me some pointers…
And if you can understand my charts at all you’re gonna crush it…

Bounced off from support, waiting for reversalToday Atossa bounced off from the support, expecting it to test 8$ soon

Long | ATOS | Week end 07/16/2021NASDAQ:ATOS
Possible Scenario: Long
Evidence: Price Action
TP1: 6.35$
TP2: 7.20$
This is my idea and could be wrong 100%, this is not a BUY/HOLD/SELL. do your own DD.

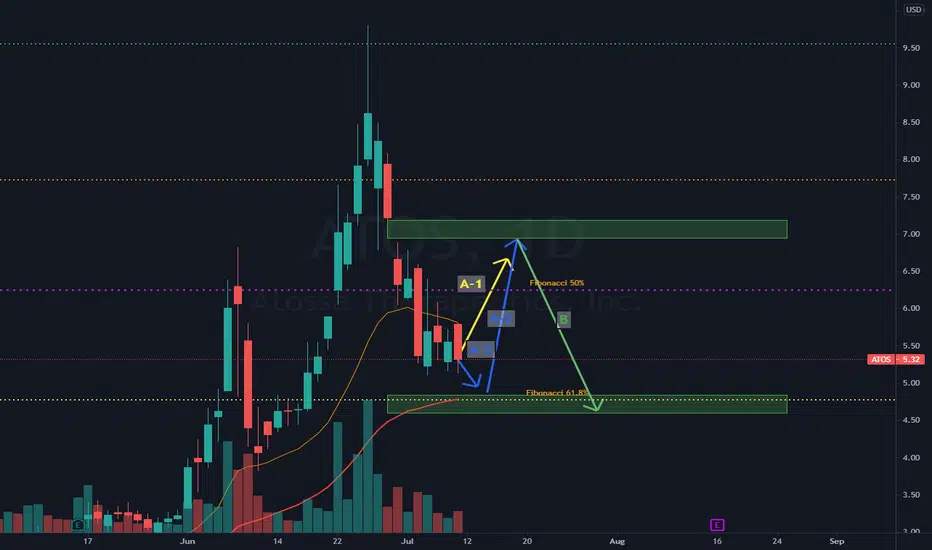
ATOS | InformativeNASDAQ:ATOS
These are possibilities for ATOS in following days
*This is my idea and could be wrong 100%.
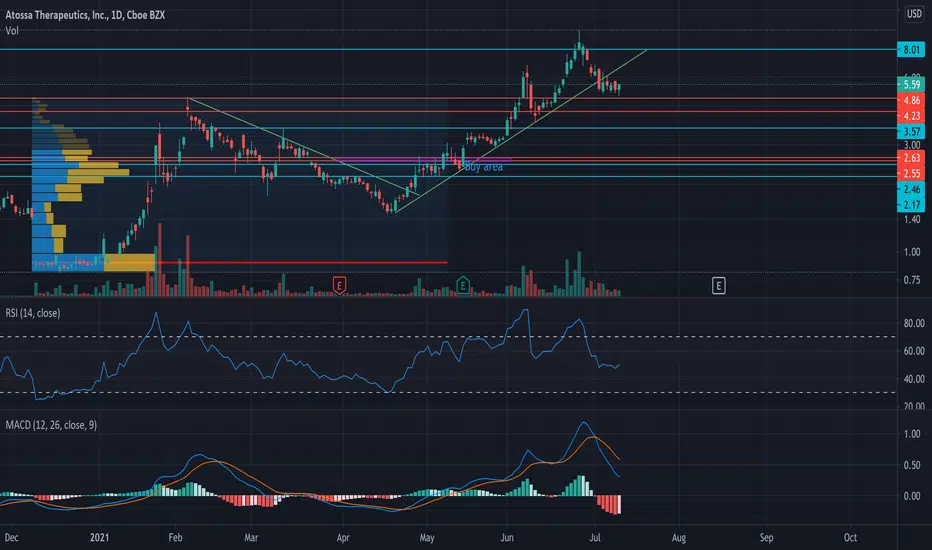
ATOS: breakout play on watchAtos has formed a nice consolidation/ bottoming base , with a clear triple bottom.
Change of trend coming?
Watch for breakout.
All levels on the charts

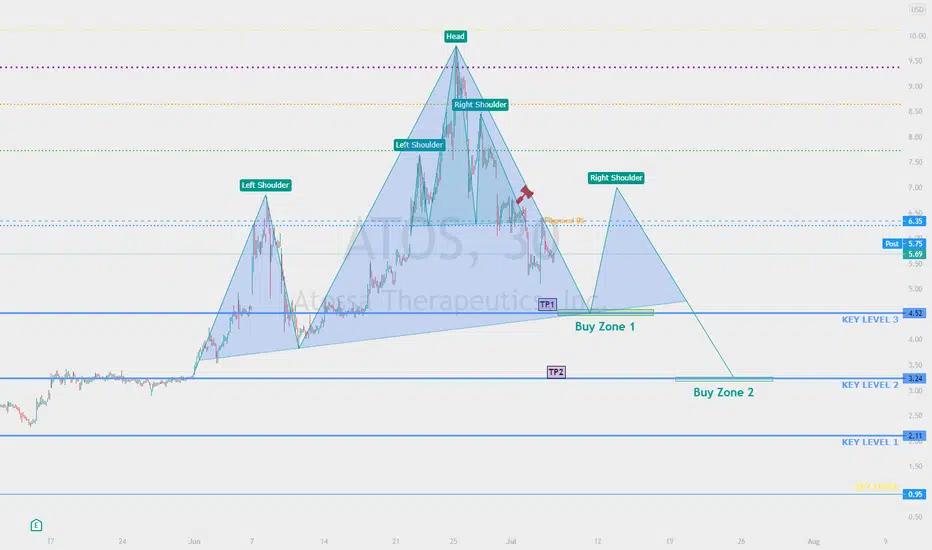
ATOS Atossa Therapeutics Head and Shoulders Chart Pattern ?It seems like ATOS Atossa Therapeutics is forming a Head and Shoulders Chart Pattern with a short term price target of 6.8usd but also a downside afterwards till $4.
I`m looking forward to read your opinion about it.
ATOS BULLISH REVERSAL If the entire market doesn't take a shit, I do think ATOS could play out this bullish formation. Broke the downtrend and retested it to perfection, now looks primed to pop up. I have put in some orders with a very tight stop loss in case the price goes south.

ATOS | InformativeNASDAQ:ATOS
Just another scenario,
This is not a BUY/SELL/HOLD, could be wrong 100%, it's just for educational and entertainment.
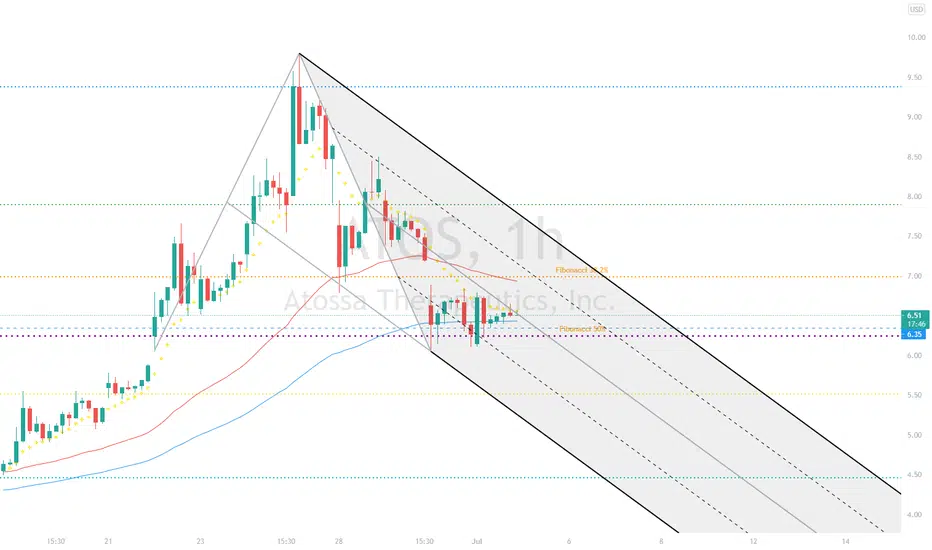
ATOS mini TA with fib linesNot surprised that we fell hard after breaking the uptrend (green line) at $8, retested the line at $8.40 to perfection and then fell about 35% to current prices.
What surprises me more is that the $5.66 support didn't hold and is now acting as a resistance zone. If we do break this mini resistance, I have no doubt that we will test the $6.60 fib region again.
Else, I can see this stock trading between the $4.10 and $5.66 region for a few days/weeks. If it does go lower and hold the 4.10 support I'm a buyer again. Good luck to all holders, I'm sure we all know the potential of this company.

ATOS | InformativeNASDAQ:ATOS
This is my idea, whatever works for you pick it.
I have no position, Neutral, observer.
* This chart is for entertainment, fantasy, obviously it's not a BUY/SELL/HOLD signal, it's 100% wrong!, LOL

ATOS short then long- Bearish Divergence on the RSI -> Possible downside into 3$ Range
- Shorts will drive Price down for another Accumulation phase -> until Markup Phase
- Gap at 7$ -> will be closed in Markup Phase

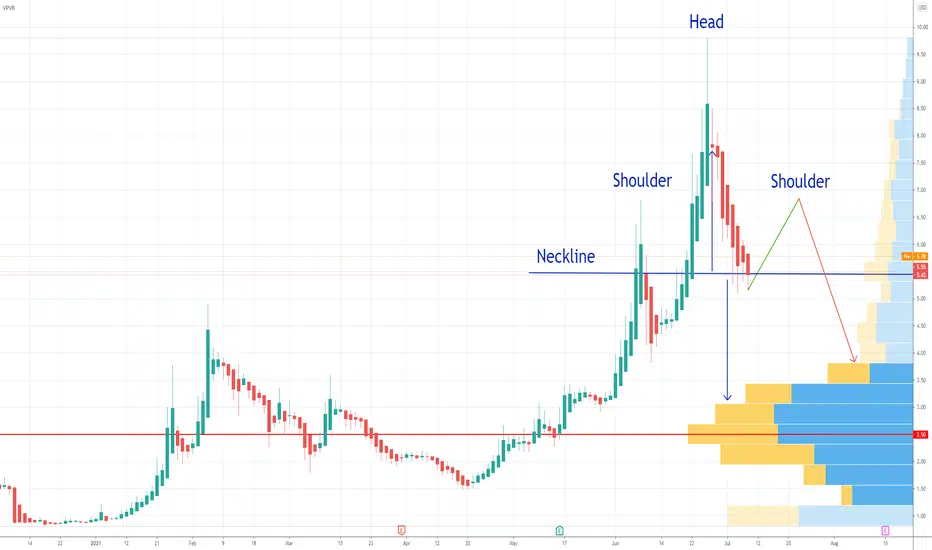
SHORT | ATOS | H&S PatternNASDAQ:ATOS
This is not a temporary pattern and I expect weeks or months of decline before any fundamental news release.
Possible Scenario: SHORT
Evidence : Bearish price action, Head and Shoulder Pattern
TP1: 4.50 TO 4.60 as buy zone
TP2: 3.20 TO 3.30 as buy zone, strong support, most of the HF accumulated at this range for 2 weeks.
It's in distribution phase of stock life-cycle
Distribution Phase
The distribution phase begins as the markup phase ends and price enters another range period. The shares are being sold over a period of time—the opposite of accumulation. This time, the sellers want to maintain higher prices until the shares are sold.
Whether it is distribution or accumulation is less easy to discern at this point. It is more important to be prepared for the next signal, rather than trying to predict the next move.
One of the most common distribution patterns is known as the head-and-shoulders pattern. Rounding or a dome shape indicates distribution preceding the markdown stage.
Source: Investopedia (www.investopedia.com)
* This is my idea and could be wrong 100%.


ATOS Pitchfork channel NASDAQ:ATOS
This is pitchfork channel to identify possible reversal sign with confirmation.
🟢NEW POSITION $ATOS Target 8.00 for 29.03%$ATOS Target 8.00 for 29.03%
Or double position at 4.40
—
On the far right of the chart is my Average (Grey) Current Target (Green), and Next Level to add (Red) Percentage to target is from my average.
I start every position with 1% of my account and build from there as needed and as possible.
I am not your financial advisor. Watch my setups first before you jump in… My trade set ups work very well and they are for my personal reference and if you decide to trade them you do so at your own risk. I will gladly answer questions to the best of my knowledge but ultimately the risk is on you. I will update targets as needed.
GL and happy trading.
I finally added my YouTube Training Video to my profile tagline since I’m not allowed to on here. It’s a quick 15 minute training video on how to set up your chart and how to spot opportunities. So check here first but If you have questions just message me.