ATVI Blizzard looking strong through the last half of the year. With the christmas season coming naturally gaming tends to pickup even more and should expect the numbers to show in Blizzard. WOW isnt there only game and they have had a talent for making money in this sector for a long time. I used the algo key code on this. and Also marked where Absorption was attempted to be made. Most likely should start pumping at this point.
by iCantw84it
07.20.2021
ATVI trade ideas

ATVI short I entered at the top once I saw the evening star form. ATVI will fall to completely fill the gap at $69.75. I'm only playing the gap fill down. Long term my bullish PT is $80 and then $100. As of right now, we need to pull back since we just recently had that major push to the upside

Bullish- Symmetrical TriangleWill be watching ATVI closely here as it's forming a large symmetrical triangle on its yearly chart. Buyer volume is starting to pick up again & Bollinger Bands are starting to squeeze. Closed on Friday almost right on top of its 200day SMA. Will be looking for a breakout of this triangle in the coming weeks- (*Broader market conditions permitting*)

ACTIVISION BLIZZARD, INC ATVINASDAQ Weekly Technical AnalysisMidterm forecast:
While the price is above the support of 89,10 , a resumption of an uptrend is expected.
We make sure when the resistance at 99,12 breaks.
If the support at 89,10 is broken, the short-term forecast -resumption of uptrend- will be invalid.
We will close our open trades if the Midterm level 89,10 is broken.
Technical analysis:
A trough is formed in the daily chart at 89,10 on 03/08/2021, so more gains to resistance(s) 99,12, and maximum to Major Resistance (108,96) is expected.
+ Trigger:
Trigger1= 99,15
+ Take Profits:
TP1=108,96
TP2=116
+ Stop:
Stop1=89,10
Stop2=99,12 (when activated and pass trigger)
❤️ If you find this helpful and want more FREE forecasts in TradingView
. . . . . Please show your support back,
. . . . . . . . Hit the 👍 LIKE button,
. . . . . . . . . . Drop some feedback below in the comment!

THIS IS NOT BITCOINThis is not bitcoin, but it sure looks like it huh? check that 53% drop after a 300% rally (measured from old all time high to new all time high)
Check that stoch risi action, and the rsi action... indicating the same buying and selling.
Bitcoin acts faster than stocks so time frames will be shortened significantly for moves, but things looking very similar. is this how bitcoins shape and recovery will look?

ATVI - 100 incoming soon ATVI - looking good here with higher lows and about to break supply zone, looking good for next 97c swing - target 100 and stop loss if dropped below 95.5

ATVI Higher?ATVI starting to look ready to run higher again. After selling off it has now fell back to its uptrend and its 200MA which has been held multiple times in the past. Look for it to consolidate around the 200MA and then bounce higher and run into earnings.
AUG 5 Earnings will take place.


ATVI looks interesting! 👀This stock has been crushed recently, but there’s a good chance it’ll do something interesting now, that is near a support level, and it is apparently oversold.
We have a congestion in the 30min, and some breakpoints ATVI must break, like the 92.08 and the 92.74. If ATVI breaks these points, we might see it bouncing to the 94s again.
The 91.50s seems to be a support for ATVI, but if it loses the 90.88, then is can just keep dropping to the 88 and close the gap.
The RSI is oversold, but this is not a buy yet, and we must wait for more confirmation. The problem is that ATVI is not reacting quickly like it did last time it hit the 87s, when the RSI was around the same level it was today, and this is something that can ruin our thesis.
Anyway, ATVI is interesting at 92 and 88, so, we should keep an eye on it!
If you liked this trading idea, remember to click on the “Follow” button to get more trading ideas like this, and if you agree with me, click on the “Agree” button 😉.
See you soon,
Melissa.


ATVI broke the restistance line and is going strong!The ATVI stock broke the restistance line and is going strong after. This is a big bull signal and i am going long. I will hold it long term and sell in about 5 years.


$ATVI Inverse Head and ShouldersActivision been basing around its 50 MA since March of this year forming an inverse head and shoulders base pattern. A strong close above neck line ($89 level) would confirm the pattern should send the stock to test its most recent high around $105

$ATVI - strat methodContinuation from daily to weekly to monthly.
Long wick green 3 bars.
Going long.

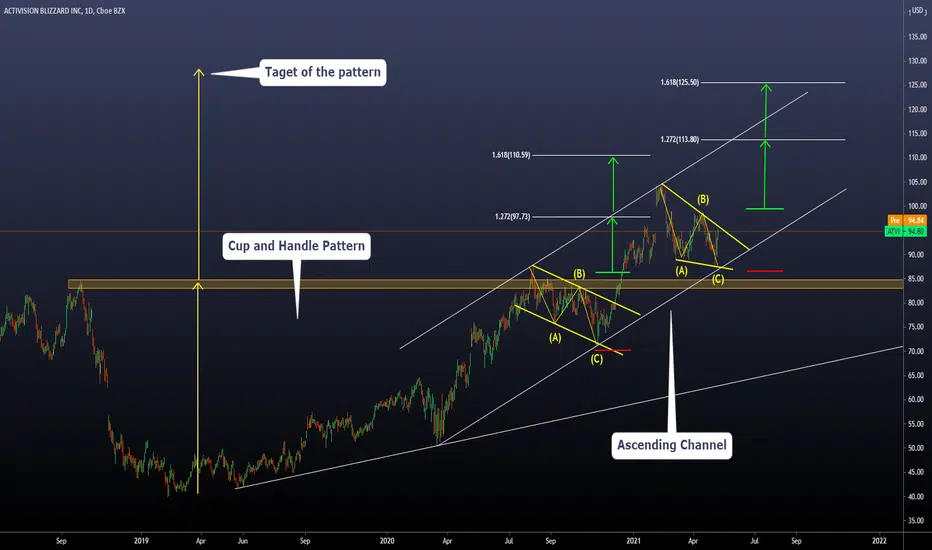
Beautiful Chart on ATVI lets breaks it downThe main aspect we can see on this chart is a huge Cup and Handle Pattern. The idea of this movement is a round bottom. The price reaching the previous ATH and finally making a Corrective movement there (ABC pattern) or the handle.
The target of the cup and handle pattern is the distance from the bottom to the previous ATH.
Currently, we are observing a new Corrective pattern (ABC) inside the ascending channel and aligned with the target of the cup and handle.
The arrows and the green and red lines we are using are the levels to say, "The analysis is active, or the analysis is invalid" We think it will be pretty intuitive for everybody to understand the meaning of them...
Final Conclusion: We think there is a new accumulation process right now, and if the price reaches the green line, we can have a continuation movement towards the end of the green arrow. The expected distance of the whole bullish movement is between 125.00 and 128.00
Have a great trading week and remember: PROTECT YOUR CAPITAL!
$ATVI - nice earningsThis stock, along with EA, is one of my favorites.
I have options with June expiration. Manage stop loss closely. it has support from volume shelf and I will risk $1 to make $4.

Activision Blizzard earningsNASDAQ:ATVI is one to watch tomorrow on earnings.
It is at a 50% level now at the close prior... but does not fit my TA rules for a long based on Ichimoku timing. Also, earnings can destroy even the best of setups. People played (and bought) a lot of video games last year but will that continue?

$ATVI - volume shelfWaiting to get on top of the volume shelf to pick up call options. This is another company with great earnings compared to the last two quarters that cannot catch a break. I like things on sale.

ATVI Activision taking a dip into liquidity looking for AccumActivision trying to hit absorption and attempting to make another run up to break the last previous high.
by iCantw84it


ATVI on watchI like the consolidation below the 618. I have alert set at 98.60. Break above that level could yield a move to 102. If it drops back below 96.50 I'm not interested.
Additional Info:
I am an intraday scalper and short term swing trader of stocks & Futures using options and equity.
I focus on high volume momentum stocks in strong uptrends.
My time frame is between 5minutes to 5 days on most trades.
I scale into positions and scale out of positions as my targets are hit.
I always trail my stops after T1 is hit to reduce risk and lock in gains.
If my post is on a Weekly/Daily/240M chart the idea is a swing trade.
If my post is on a 60M chart or lower the idea is a day trade.
Day trades can turn into swing trades if the stock is strong.
All trades should be supported by market direction.
Treat my posts as trade ideas and not signals.
Traders must trade using their own back tested trade plan and rules.
Traders must plan risk first and profits second.
Additional Additional Info:
If you use options to trade high IV stocks it is crucial to wait for some consolidation or a pull back.
If you buy an option when price is stretched you will find that even when the instrument trades in your
direction you will lose money because you will have paid too much premium.
Simple rule = BUY options when candles are SMALL and SELL options when candles are BIG.
