AVGO - bearish move short-termAVGO has been in a short-term uptrend. However it looks that the price is approaching the key resistance. We expect that the stock price may decrease in the coming period.
Therefore, we recommend taking a short position when and only if the price breaks the upsloping trendline that has been acting as a support. Once the price breaks this support , we can enter a short position, however it’s also possible to enter short when the price bounce back up and retests the trendline, get rejected and confirm it as a resistance.
When we look at the RSI, we see that there is a regular bearish divergence. That divergence shows the buyers exhaustion therefore there is a high probability that the price of the AVGO will go down in the next few days. We recommend closing to the short at 0.618 Fibonacci point. Target is shown on the chart.
AVGO trade ideas

Ready to break upCheck my previous post below. Good time to add or open a long position if you missed it before.

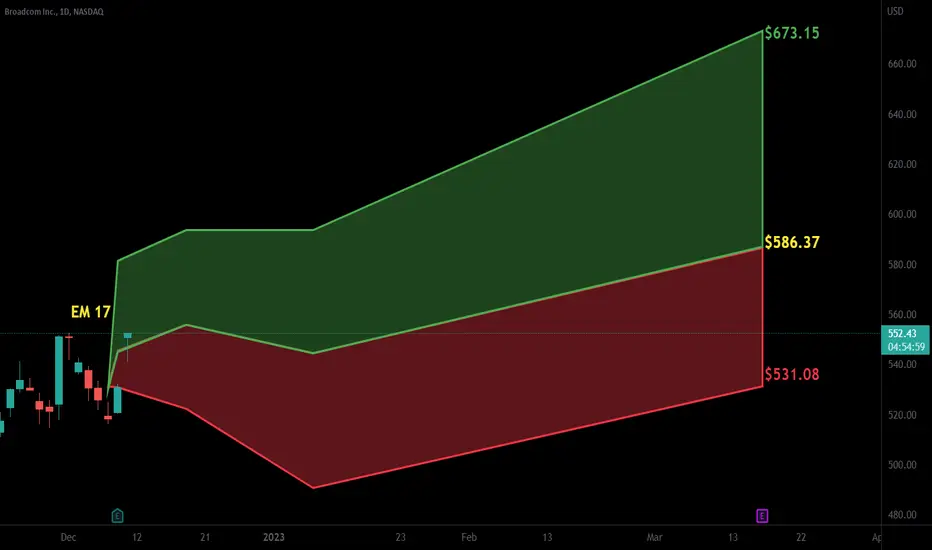
Bearish to upper 400sNeeds to breakdown below 552 to set this in motion, but a few gaps to fill to downside and upside has run its course for now.
Initial target range in coming weeks is 492-520 (point target 505)
Goal target is around 475 where it will accumulate and form right shoulder of larger accumulation structure around the 2022 low. From the right shoulder it will begin next bullish cycle to new all time highs.


$AVGO with a Bullish outlook following its earnings #Stocks The PEAD projected a Bullish outlook for $AVGO after a Positive over reaction following its earnings release placing the stock in drift B with an expected accuracy of 83.33%.
AVGO Broadcom Options Ahead Of EarningsIf you haven`t sold AVGO`s exposure to China:
Then looking at the AVGO Broadcom options chain ahead of earnings , i would buy the $515 strike price Calls with
2022-12-16 expiration date for about
$7.60 premium.
If the options turn out to be profitable Before the earnings release, i would sell at least 50%.
Looking forward to read your opinion about it.

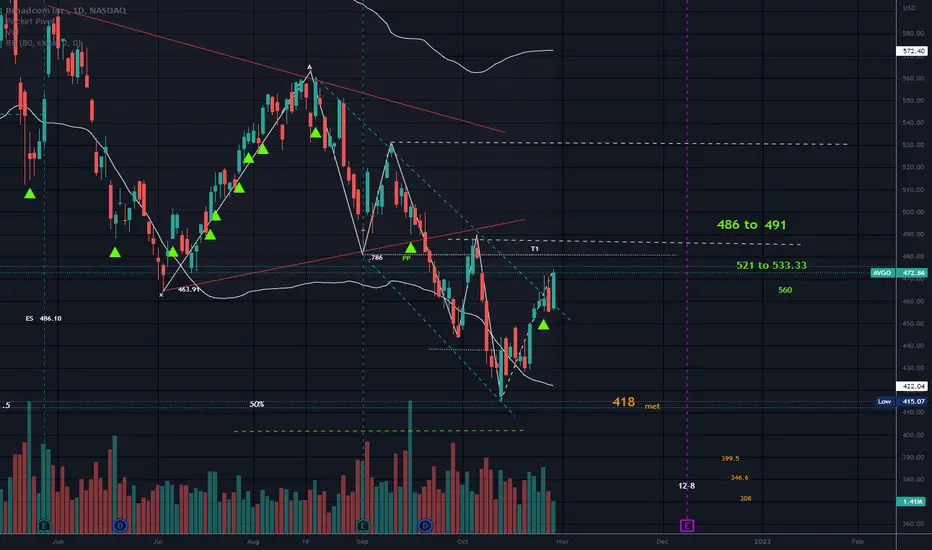
Break Up From Channel DownJust when you thought the semiconductor trade was over! LOL
Price has broken up from the channel down.
Down from a symmetrical triangle but appears to have been resuscitated and is breathing today.
Target 1 to the downside met.
No recommendation.
W pattern with valley 2 lower than valley 1.
AVGO: Support Retest LikelyIts very possible that AVGO will be heading back to the 400 levels after rallying up to the resistance levels in the ~520s. Semis have had a strong run and the bounce on AVGO has been fairly significant without any convincing establishment of support levels on the way up. With this and the upcoming economic catalysts, its likely that a significant retrace is on the way.
Alternatively, there is the chance of a bullish continuation so this is a trade that needs to be quickly closed if it begins to breach the current resistant levels.

AVGO LongDespite Semis' weak this week, AVGO looks strong. with tight SL I am want to see bounce up next week for avgo

Short $AVGO from 520Again, we have a setup with 4th test to top of channel. I hope to get filled at 520 when market opens monday. Here is a potential for a 25% scalp within 2-3 months. R/R is (as always) around 1:3
Entry: 520
SL: 564.5
TP: 393.5

AVGO: Head and Shoulders?Broadcom
Intraday - We look to Buy at 457.26 (stop at 435.69)
A bullish reverse Head and Shoulders is forming. This is positive for sentiment and the uptrend has potential to return. The measured move target is 512.00. Dip buying offers good risk/reward.
Our profit targets will be 510.99 and 530.00
Resistance: 512.00 / 574.00 / 670.00
Support: 450.00 / 350.00 / 260.00
Please be advised that the information presented on TradingView is provided to Vantage (‘Vantage Global Limited’, ‘we’) by a third-party provider (‘Signal Centre’). Please be reminded that you are solely responsible for the trading decisions on your account. There is a very high degree of risk involved in trading. Any information and/or content is intended entirely for research, educational and informational purposes only and does not constitute investment or consultation advice or investment strategy. The information is not tailored to the investment needs of any specific person and therefore does not involve a consideration of any of the investment objectives, financial situation or needs of any viewer that may receive it. Kindly also note that past performance is not a reliable indicator of future results. Actual results may differ materially from those anticipated in forward-looking or past performance statements. We assume no liability as to the accuracy or completeness of any of the information and/or content provided herein and the Company cannot be held responsible for any omission, mistake nor for any loss or damage including without limitation to any loss of profit which may arise from reliance on any information supplied by Signal Centre.

ButterflyBullish.
Butterflies are often found at tops and at bottoms.
The butterfly should terminate close to the 1.272 of XA. This one was a bit shy of the 1.272.
The 2nd leg, the retracement should be close to the .786 of XA.
Peak 2 is lower than peak 1. It is a crooked M.
There is no pocket pivot noted at this last leg yet price gapped up.
In a perfect world targets for this pattern would be a the white lines I drew.
I am not sure this is a perfect world though.
This broke down from a triangle and the bottom trendline of that triangle could act as resistance.
No recommendation.
The butterfly is an extension pattern and the final leg ends below X in the bullish version.
It is also considered a price exhaustion pattern.
Target 1 level can also cause some resistance and sometimes all you get is T1 )o:
Every stock is different just like everyday in this market can be different.

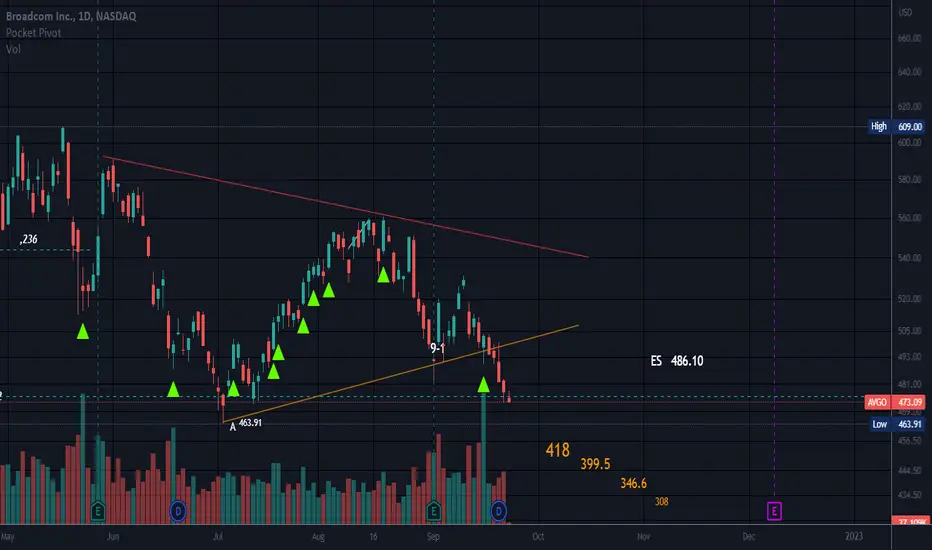
Symmetrical TriangleAppears to have broken to the downside.
Price is at the .382 of the trend up.
No recommendation
$AVGO with a Bullish outlook following its earnings #Stocks The PEAD projected a Bullish outlook for $AVGO after a Positive over reaction following its earnings release placing the stock in drift B with an expected accuracy of 80%.

AVGO Broadcom Options Ahead Of EarningsLooking at the AVGO Broadcom options chain, i would buy the $410 strike price Puts with
2022-11-18 expiration date for about
$6.00 premium.
Looking forward to read your opinion about it.


Strong Buy AVGO:547.27We consider a strong buy for Broadcom Inc, rating the company as the absolute leader in semiconductors

Bouncing on POCAVGO has returned to its post-March 2020 point of control.
Stepping down a time frame to the daily chart, we can see a cluster of Dojis. Combined with volume falling under the 50day average, MACD crossing its signal, and Stoch recovering from oversold shows hesitation in the selloff.
An aggressive trade would be to enter now, while a more conservative entry would be above the support or resistance zone just north of the 21EMA.

Broadcom's Bearish OutlookAVGO showing quite textbook looking waves with fib confluence, expecting current impulse wave down to at least touch the previous major support. If price hits this target, I'd expect it to be the beginning of a deeper correction.

AVGO 481Timeframe: Multi-month swing
Last week AVGO retested and rejected the weekly 10MA yet again and sold off rather quickly. I'm targeting price to eventually make it to 481 over the next month or two. For the last 3 weeks we have yet to get above the golden zone around 594-598. We have also yet to close above the weekly 10MA for 10 weeks.
How to play this?
• I'll be looking for price to cross 539.72 to signal that AVGO would like to go lower in the coming weeks. If price never crosses below that level this week then we can play the upside.
• Once the trigger hits I would be getting in to take it to 531.
Trigger (539.72) then reversal plan:
• I would look for a bearish reversal pattern on the daily around 558 and 562 to take it short.
Things to look out for:
• Be aware that price can cross 539 this week, reverse to 558, and then reverse again the following week.
• Short term I could see some upside retracement to 558-562 to retest last week's price area. There is very strong supply at this level as it is the bottom of the VWAP (from April 2022). This means a lot of folks are holding the bag and they might be anxious to get out at that level.
Short Invalidation/Bullish:
Short invalidation area is at 576.27. At that point I would take it up to 583, 594 then 598 (golden fibs).

AVGO more downsideWent parabolic end of last year, broke down from that and has yet to complete full downside move.
Expecting 490s by early July.

$AVGO with a Bullish outlook following its earnings #Stocks The PEAD projected a Bullish outlook for $AVGO after a Negative over reaction following its earnings release placing the stock in drift C.

AVGO bull put spreadBelow the 200 SMA on daily. AVGO has had pretty decent strength for a bit. Not expecting it to TANK in 2 weeks.
