AVPT: All Eyes on $19.81 — Top or Takeoff?This chart of AvePoint Inc. (AVPT) shows strong bullish price action recently, but there are signals emerging that suggest a potential top may be forming or at least that we’re approaching resistance with caution warranted. Let’s break this down:
1. Price Action & Key Resistance
Current Price: $19.60
Horizontal Resistance: The blue line at around $19.81 marks a prior swing high — this is a psychological and technical resistance level. Price rallied sharply from the FWB:14S to $19+, and we are right at the resistance level.
2. Moving Averages (50 / 200-day)
Golden Cross confirmed: The 50-day MA (orange) is trading above the 200-day MA (green), supporting a longer-term bullish trend. However, the price is extended above both MAs. Historically, when price stretches too far above the 50/200 MAs without consolidation, it tends to revert or stall.
3. Volume Analysis
Volume spiked on the recent rally but now appears to be fading slightly. Declining volume into resistance often signals buyer exhaustion — one of the first signs of a potential top.
4. Fibonacci Retracement
If we pull a Fibonacci retracement from the recent low (~$10 in mid-2024) to the current high: The 1.0 Fib level aligns near the $19.60–$20 zone, which matches historical resistance — confluence of resistance strengthens the top-call argument. If price reverses here, the 0.618 level (~$15–16) could be the next downside target.
5. MACD: Bearish Divergence Setup?
MACD Line (blue): 1.21, Signal Line (orange): 0.9097 — bullish crossover still active. However: MACD histogram is flattening, showing momentum slowing down. MACD peak today is lower than Dec 2024, while price is attempting to re-test the same high — that’s a bearish divergence in the making. Early warning that this momentum rally could be losing steam.
What Constitutes a Real Breakout on this one?
1. Clean Daily Close Above $19.81
Not just an intraday wick — we want a full-bodied candle close above $19.81, ideally above $20.00, to show strength and commitment. Ideally with a range expansion bar (long candle body), not a doji or spinning top.
2. Surge in Volume
Breakouts must be accompanied by volume — think 30–50%+ above average daily volume. It tells you institutions are behind the move, not just retail FOMO or weak hands.
3. Follow-through the Next Day
After the breakout, the next session should not gap and fade. You want to see continued buying or at least a tight consolidation above prior resistance (which then becomes support).
4. Momentum Confirmation (MACD, RSI)
MACD histogram expanding, not flattening. RSI breaking above 70 and holding, without bearish divergence. If MACD and RSI diverge while price breaks out, that’s a red flag (weak breakout).
5. No Immediate Rejection or Reversal
Watch for a "fake breakout" — when price spikes above resistance intraday or for one session, then closes below the level the next day. That’s a bull trap and often marks a local top.
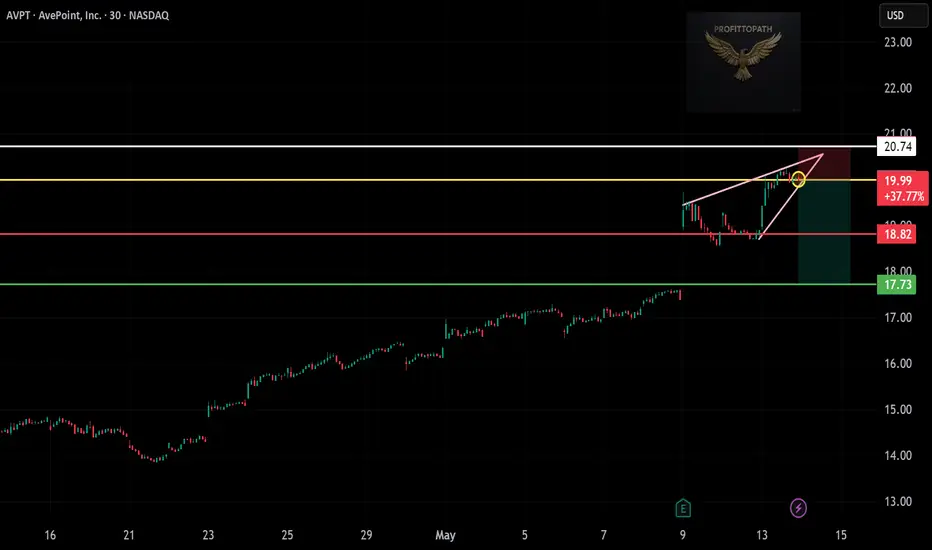
AVPT trade ideas

Short Trade Setup – AVPT!📉
🔹 Asset: AvePoint, Inc. (NASDAQ: AVPT)
🔹 Timeframe: 30-Minute Chart
🔹 Setup Type: Rising Wedge Breakdown (Bearish Reversal)
📌 Trade Plan (Short Position)
✅ Entry Zone: Around $19.99 (yellow line – wedge resistance + price rejection)
❌ Stop-Loss (SL): Above $20.74 (white line – wedge invalidation)
🎯 Take Profit Targets:
📌 TP1: $18.82 (red line – recent support)
📌 TP2: $17.73 (green line – key support zone)
📊 Risk-Reward Calculation
Risk: $20.74 - $19.99 = $0.75
Reward to TP1: $19.99 - $18.82 = $1.17 → R:R = 1:1.56 ✅
Reward to TP2: $19.99 - $17.73 = $2.26 → R:R = 1:3.01 ✅✅
🔍 Technical Highlights
Tight rising wedge forming near recent highs
Clear rejection at resistance zone (yellow line)
Trendline (pink) and wedge resistance converging
Potential loss of bullish momentum at top
🎯 Execution Plan
🔽 Enter short around $19.99 on bearish confirmation
🛑 Stop-loss above $20.74 to avoid false breakout
💵 TP1 for quick exit, let rest ride to TP2
⚠️ Exit Strategy
Bullish breakout candle above $20.74
High-volume upside = setup invalid
✅ Final Take
Strong bearish wedge setup with favorable risk-reward. Ideal for short traders watching breakdown patterns.
New Setup: AVPTAVPT : I have a swing trade setup signal. I'm looking to enter long if the stock can manage to CLOSE above the last candle high(BUY). If triggered, I will then place a stop-loss below (SL) and a price target above it(TP-50%,move SL to breakeven), then using the close below the 10SMA as my trailing stop loss. **Note: The above setups will remain valid until the stock CLOSES BELOW my set stop-loss level(SL).

New Setup: AVPTAVPT: I have a swing trade setup. I'm looking to enter long if the stock can manage to CLOSE above the last candle highs. If triggered, I will then place a stop-loss below (SL) and a price target above it(TP-50%,move SL to breakeven), then using the close below the 10SMA as a trailing stop loss.

AvePoint, Inc.
There was a pullback recently, but the price is attempting to recover, as shown by the recent green candlestick.
The price is currently near the upper band of the Bollinger Bands, which suggests that it might be overbought or could be nearing resistance.
However, the overall trend remains upward, as the bands are expanding, which indicates increasing volatility and potential for further price movement.
Resistance: The price has faced resistance near the $12.00 level, as seen by the recent small pullback. If it can break above this level, it may have room to continue higher.
Support: Support appears to be around $11.00, where the price has found buyers in previous pullbacks.
Bullish Case: If the price breaks above the $12.00 level with strong volume, it may continue its upward momentum, testing previous highs.
Bearish Case: If the price cannot hold above the middle Bollinger Band or the blue moving average, a pullback towards $11.00 or even $10.50 could occur.
This setup suggests a bullish continuation, but caution is advised near the resistance area of $12.00, as it may need more momentum or a pullback to gain strength for a breakout.

AVPT Shorting StrategyAVPT is extended above the EMA200 in the weekly timeframe, RSI is over 70 both in the daily and weekly timeframe.
We are now heading towards another supply zone coupled with a double order block (weekly & daily).
How to trade :
Entering into a short position once price crosses the -OB dashed line. ($10.69)


Risky buy point%using Google translate
The ideal time to buy was when the stock price was $8.56. There are signs that institutional investors have been purchasing additional stocks for three weeks. It's a little late now, but if you're lucky, you might see decent results. If possible, invest only a small amount of money at a price lower than $10.05 and take a tight stop loss.

AvepointAVPT witnessed a strong rebound after forming a minor higher bottom at 8$, violating the major resistance area 8.61$ - 8.74$, and the confirmation of that breakout by remaining above 8.74$ in Monday's session. which will trigger further rises near 9.03$ - 9.32$ - 9.58$ - 9.86$ - 10.15$ - 10.55$ on the short-term.
the indicators are heading towards the positive side, which confirms the mentioned positive scenario.
The information and publications are not intended to be or constitute any financial, investment, commercial, or other types of advice or recommendations provided.

AvePoint Moving Out of Large BaseAvePoint, Inc. NASDAQ:AVPT
☕Large Base - Cup (5m or 155d)
📦Small Base - Handle (28d Range < -8%)
🔊Volume - Increased on the handle and visibly larger on the weekly chart.
🪵Earnings and Sales Growth.🔥

AVPT AVEPOINT Let's try to make money on this idea.
It is not an individual investment recommendation.

AVPT under institutional accumulation? Institutes need to pack their ETF's with high-quality stocks. Here is a high-quality beaten-down stock that suffered the fate of many SPACs.
Using an indicator developed by @JohnMuchow () it may be possible to find out when this occurs. Per John's write up:
" The Ants indicator is based on the research of David Ryan, three-time winner of the U.S. Investing Championship. David came up with the idea for the indicator while managing the New USA Growth Fund at William O’Neil + Company. David was interested to understand what drove some stocks higher once they were extended from their most recent base, while others had only moderate moves up.
What David found during his research was that stocks making the biggest moves often had consistent buying on volume over a period of 12 to 15 trading days. Stocks with these characteristics may be under institutional accumulation, where it may take days to weeks to fill a position. "
This stock is beaten down with a good deal of overhead supply. So even buying it above the most recent resistance ($6.10) may be akin to rooting for Sisyphus rolling the boulder up the hill....
... but who knows? May be worth putting this on a watch list,

AVPT $10 INCOMINGall aboard the money train, riding this one up 80% from here to the price target marked.

AVPT LongTrendline break
Entry 8.8
Stop 7.8
Target1 10
Target2 12
Risk management is much more important than a good entry point.
The max Risk of each plan should be less than 1% of an account.
I am not a PRO trader. I trade option to test my trading plan with small cost.

AVPT - Short Term risk - Long term gainAVPT - very interesting company.
Earnings came out - Guidance is not changed for the year while Q2 earnings (revenue / subscription) were a record high - better than expected.
Despite that it went down.
Company has 250mio cash on hand so part of valuation is already absorbed from there. Solid outlook.
Short term, also after how it behaved after earnings, I expect to stay in the closing wedge with up and downs.
Lowest 8.50 (I don`t think we will see it but part of the wedge) higher 10.60 till next earnings.
in Q3 earnings release, I hope the company will smash earnings as well but also provide future optimistic guidance.
With current valuations, that kind of a guidance will easily carry the company around 13-14$ range by year end.

AVPT Continues UptrendAVPT is a major partner with MSFT; as MSFT has good fundamentals & is in an uptrend, AVPT may benefit.
AVPT has strong technicals & early indications of sound financials & is likely to be more volatile than MSFT leading to better opportunities for outsized gains; but also outsized reversions.
As the moving averages form a bullish cross this could be a great opportunity. As charted, at least a 2:1 risk to reward ratio. Set stop loss as indicated. Watch for a failure to form a bullish MA cross.
