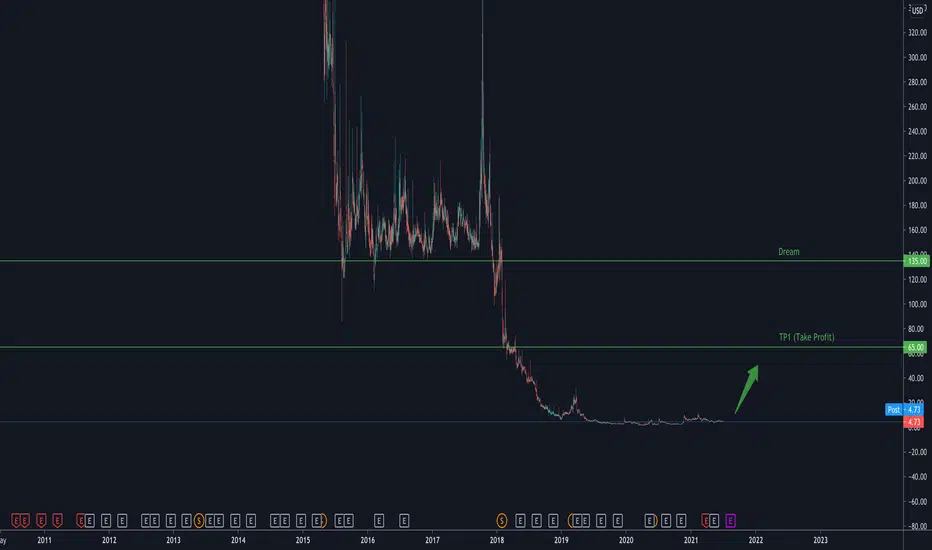
AYRO electric vehicles*investment opportunity*
On the above monthly chart 7 years of price action resistance comes to an end following an oversold condition (orange column) with price action breakout. There now exists a number of reasons to be bullish on AYRO, they include:
1) Regular bullish divergence. Price action m
Next report date
—
Report period
—
EPS estimate
—
Revenue estimate
—
−9.49 USD
−1.76 M USD
63.78 K USD
450.45 K
About AYRO, Inc.
Sector
Industry
CEO
Joshua Nathaniel Silverman
Website
Headquarters
New York
Founded
2016
FIGI
BBG000F4HP82
AYRO, Inc. engages in the design, development, manufacture, and sale of compact electric fleet solutions for use within urban and short-haul markets. It offers the AYRO 311 and Club Car 411 models. The company was founded on May 19, 2016 and is headquartered in New York, NY.
Related stocks

$AYRO Potential Long Target -> $1.60$AYRO broke the resistance level at $1.10
It could run all the way to the next resistance level at $1.6 in the coming days

AYRO is gearing momentumAYRO started the day with heavy volume. Looks like it want's to come back. If daily close is below 1.08 we can scrap the trade.

AYRO prediction AYRO looking over sold here low risk since it's so bottomed out. Taking it for a swing...


AYRO - D :: Possibility of a Recovery is RealStill, with Covid-19 cases fading and gradually declining, the possibility of a recovery is real. So if you really want to play, AYRO could be your ticket.
Ayro Possible inverse Head & Shoulders detected within a C&HNASDAQ:AYRO has a lot of potential as an American Company focussing on a niche. Now everything starts opening up post Corona era, it should be able to sign contracts and start delivering their EVs.
Also at February 11th they had entered into definitive agreements with several institutional and acc


6/18 $5 Call AYROPossible reversal in trading channel
Enry at long signal or breakthrough entry point
especially if MACD breaks zero
goal is target 1
watch for reversal if going for target 2
NASDAQ:AYRO


See all ideas
Summarizing what the indicators are suggesting.
Oscillators
Neutral
SellBuy
Strong sellStrong buy
Strong sellSellNeutralBuyStrong buy
Oscillators
Neutral
SellBuy
Strong sellStrong buy
Strong sellSellNeutralBuyStrong buy
Summary
Neutral
SellBuy
Strong sellStrong buy
Strong sellSellNeutralBuyStrong buy
Summary
Neutral
SellBuy
Strong sellStrong buy
Strong sellSellNeutralBuyStrong buy
Summary
Neutral
SellBuy
Strong sellStrong buy
Strong sellSellNeutralBuyStrong buy
Moving Averages
Neutral
SellBuy
Strong sellStrong buy
Strong sellSellNeutralBuyStrong buy
Moving Averages
Neutral
SellBuy
Strong sellStrong buy
Strong sellSellNeutralBuyStrong buy
Displays a symbol's price movements over previous years to identify recurring trends.
Frequently Asked Questions
The current price of AYRO is 7.17 USD — it has decreased by −7.24% in the past 24 hours. Watch AYRO, Inc. stock price performance more closely on the chart.
Depending on the exchange, the stock ticker may vary. For instance, on NASDAQ exchange AYRO, Inc. stocks are traded under the ticker AYRO.
AYRO stock has risen by 0.84% compared to the previous week, the month change is a −9.36% fall, over the last year AYRO, Inc. has showed a −41.85% decrease.
AYRO reached its all-time high on Oct 13, 2003 with the price of 49,106,536.00 USD, and its all-time low was 5.17 USD and was reached on Jun 24, 2025. View more price dynamics on AYRO chart.
See other stocks reaching their highest and lowest prices.
See other stocks reaching their highest and lowest prices.
AYRO stock is 9.65% volatile and has beta coefficient of 0.38. Track AYRO, Inc. stock price on the chart and check out the list of the most volatile stocks — is AYRO, Inc. there?
Today AYRO, Inc. has the market capitalization of 3.89 M, it has decreased by −10.92% over the last week.
Yes, you can track AYRO, Inc. financials in yearly and quarterly reports right on TradingView.
AYRO, Inc. is going to release the next earnings report on Aug 12, 2025. Keep track of upcoming events with our Earnings Calendar.
AYRO net income for the last quarter is 845.01 K USD, while the quarter before that showed −5.58 M USD of net income which accounts for 115.14% change. Track more AYRO, Inc. financial stats to get the full picture.
No, AYRO doesn't pay any dividends to its shareholders. But don't worry, we've prepared a list of high-dividend stocks for you.
EBITDA measures a company's operating performance, its growth signifies an improvement in the efficiency of a company. AYRO, Inc. EBITDA is −12.90 M USD, and current EBITDA margin is −24.79 K%. See more stats in AYRO, Inc. financial statements.
Like other stocks, AYRO shares are traded on stock exchanges, e.g. Nasdaq, Nyse, Euronext, and the easiest way to buy them is through an online stock broker. To do this, you need to open an account and follow a broker's procedures, then start trading. You can trade AYRO, Inc. stock right from TradingView charts — choose your broker and connect to your account.
Investing in stocks requires a comprehensive research: you should carefully study all the available data, e.g. company's financials, related news, and its technical analysis. So AYRO, Inc. technincal analysis shows the neutral today, and its 1 week rating is neutral. Since market conditions are prone to changes, it's worth looking a bit further into the future — according to the 1 month rating AYRO, Inc. stock shows the sell signal. See more of AYRO, Inc. technicals for a more comprehensive analysis.
If you're still not sure, try looking for inspiration in our curated watchlists.
If you're still not sure, try looking for inspiration in our curated watchlists.