BEAM Unsure.BEAM
Well this stock has seen it's ups and downs.
Has it formed a base? I don't know.
It looks to be a long for me.
let me know.
Thanks
BEAM trade ideas
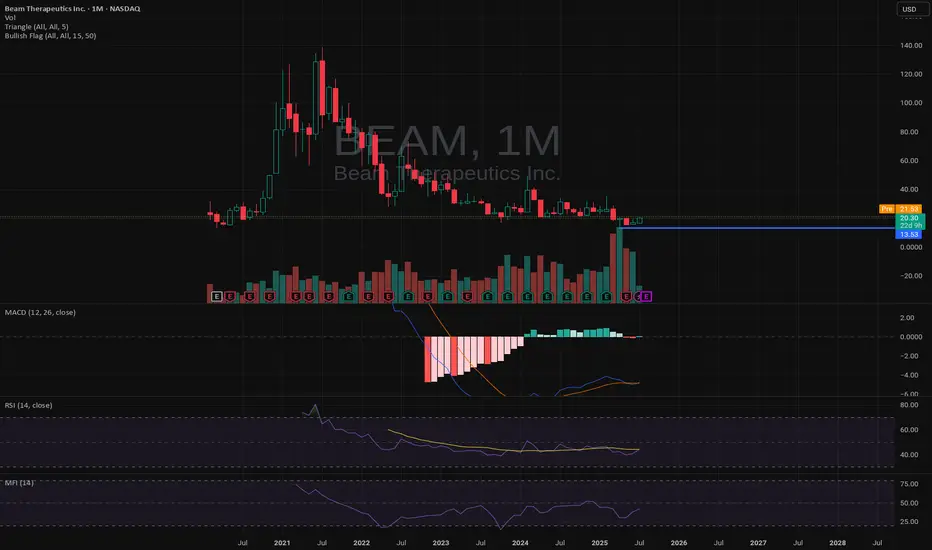
BEAM The stock chart for Beam Therapeutics Inc. (BEAM) displays an ascending triangle pattern, a bullish continuation signal. The target price of $24.45, marked on the chart, suggests a potential 45-46% upside, calculated by adding the triangle’s height (approximately $4.87) to the breakout level, with an expected path involving initial confirmation above $16.87, a steady rise toward $20.00, and further gains toward the target over days to weeks. Key resistance levels to watch are $20.00 and $22.00, with support at $16.87 and the rising trendline, though the stock’s movement may be influenced by market conditions, biotech sector trends, and company-specific news, with potential for volatility and pullbacks along the way.

When I look at $Beam sideways...If I'm being honest I don't really know what I'm doing... but sometimes when I glimpse at Beam it reminds me of Palantir. Wishful thinking perhaps, only time will tell.

BEAM – 30-Min Long Trade Setup!📈 🟢
🔹 Asset: Beam Therapeutics Inc. (BEAM – NASDAQ)
🔹 Timeframe: 30-Min Chart
🔹 Setup Type: Ascending Triangle Breakout + Retest
📊 Trade Plan – Long Position
✅ Entry Zone: $17.00 (Breakout confirmation at triangle apex)
✅ Stop-Loss (SL): $15.75 (Below trendline + recent support)
🎯 Take Profit Targets:
📌 TP1: $19.10 – Previous resistance zone
📌 TP2: $21.52 – Gap-fill / major resistance
📐 Risk-Reward Calculation
🟥 Risk: $1.25/share
🟩 Reward to TP2: $4.52/share
📊 R/R Ratio: ~1 : 3.6 – Solid swing setup
🔍 Technical Highlights
📌 Strong ascending triangle formation ✔
📌 Volume picking up at breakout zone ✔
📌 Resistance squeeze at $17 forming pressure ✔
📌 Bullish structure: higher lows + base holding ✔
📉 Risk Management Strategy
🔁 Move SL to breakeven at TP1
💰 Lock partial gains at TP1
🚀 Ride the rest to TP2
🚨 Setup Invalidation If:
❌ Price closes below $15.75
❌ False breakout without volume
❌ Breakdown below ascending trendline
🔗 #BEAM #TriangleBreakout #SwingTrade #NASDAQ #ProfittoPath #ChartPattern #SmartMoney #VolumeSpike #RiskReward #TechnicalSetup

BEAM – 30-Min Short Trade Setup!📉
🔹 Ticker: BEAM (NASDAQ)
🔹 Setup: Rising Wedge Breakdown + Resistance Rejection
🔸 Breakdown Price: ~$18.48
📊 Trade Plan (Short Position)
✅ Entry Zone: $18.40–$18.55 (yellow zone rejection)
✅ Stop Loss (SL): Above $19.83 (white resistance zone)
✅ Take Profit Targets:
📌 TP1: $17.14 (red zone – minor support)
📌 TP2: $15.11 (green zone – major support)
📐 Risk-Reward Analysis
📉 Risk:
$19.83 - $18.48 = $1.35
📈 Reward to TP1:
$18.48 - $17.14 = $1.34 → 0.99:1 R/R
📈 Reward to TP2:
$18.48 - $15.11 = $3.37 → 2.5:1 R/R
🔍 Technical Highlights
Breakdown from rising wedge support
Rejected from previous resistance zone
Price lost structure and closed below trendline
Potential momentum building for downside move
⚙️ Trade Management Strategy
🔄 After TP1:
– Move SL to entry
– Lock in 50% profit
📉 Let the rest ride to TP2 with trailing SL
⚠️ Setup Invalidation
❌ Price breaks back above $19.83
❌ Bullish breakout with strong volume
❌ Failure to hold below wedge base

Long Trade Setup Breakdown for (BEAM) - 30!📊 Chart
🔹 Asset: Beam Therapeutics Inc. (BEAM)
🔹 Timeframe: 30-Min Chart
🔹 Setup Type: Symmetrical Triangle Breakout
🚀 Trade Plan (Long Position):
✅ Entry Zone: $32.40 (Breakout Confirmation)
✅ Stop-Loss (SL): $29.56 (Below Support)
🎯 Take Profit Targets (Long Trade):
📌 TP1: $35.64 (First Resistance)
📌 TP2: $39.32 (Extended Bullish Target)
📊 Risk-Reward Ratio Calculation:
📈 Risk (Stop-Loss Distance):
$32.40 - $29.56 = $2.84
📈 Reward to TP1:
$35.64 - $32.40 = $3.24
💰 Risk-Reward Ratio to TP1: 1:1.14
📈 Reward to TP2:
$39.32 - $32.40 = $6.92
💰 Risk-Reward Ratio to TP2: 1:2.43
🔍 Technical Analysis & Strategy:
📌 Breakout Confirmation: Strong buying momentum above $32.40 signals continuation.
📌 Pattern Formation: Symmetrical Triangle Breakout, indicating bullish movement.
📊 Key Support & Resistance Levels:
🟢 $29.56 (Strong Support / SL Level)
🟡 $32.40 (Breakout Zone / Entry)
🔴 $35.64 (First Profit Target / Resistance)
🟢 $39.32 (Final Target for Momentum Extension)
🚀 Momentum Shift Expected:
If price sustains above $32.40, it could push towards $35.64 and $39.32.
A high-volume breakout would confirm trend continuation.
🔥 Trade Execution & Risk Management:
📊 Volume Confirmation: Ensure buying volume remains strong after breakout.
📈 Trailing Stop Strategy: If price reaches TP1 ($35.64), move SL to entry ($32.40) to lock in profits.
💰 Partial Profit Booking Strategy:
✔ Take 50% profits at $35.64, let the rest run to $39.32.
✔ Adjust Stop-Loss to Break-even ($32.40) after TP1 is hit.
⚠️ Fake Breakout Risk:
If price drops below $32.40, be cautious and watch for a retest before re-entering.
🚀 Final Thoughts:
✔ Bullish Setup – If price holds above $32.40, higher targets are expected.
✔ Momentum Shift Possible – Watch for volume confirmation.
✔ Favorable Risk-Reward Ratio – 1:1.14 to TP1, 1:2.43 to TP2.
💡 Stick to the plan, manage risk, and trade smart! 🚀🏆
🔗 #StockTrading #BEAM #BreakoutTrade #TechnicalAnalysis #MarketTrends #ProfittoPath


Beam $BEAM Long In the case of Beam Therapeutics ( NASDAQ:BEAM ), the weekly chart displays a promising pattern characterized by a higher low, indicating a potential bottoming process in the stock's price movement. This higher low suggests a reversal of the previous downtrend and potentially signals a shift towards bullish momentum. Moreover, technical analysis of the stock's price action identifies significant resistance lines, particularly at $39.60. If Beam Therapeutics manages to breach this resistance level, there's a projected gain of approximately 61%. Furthermore, should the stock extend its upward movement beyond this resistance point, reaching the extension level of $67.90, the potential gain could soar as high as 181%. These projections highlight the considerable upside potential for investors considering positions in Beam Therapeutics. However, it's essential to exercise caution and conduct thorough research before making investment decisions. Market conditions, company fundamentals, and external factors can all influence the stock's performance. Therefore, investors should analyze multiple indicators and seek advice from financial professionals to ensure informed and strategic investment strategies aligned with their financial goals and risk tolerance.

Cathie Wood is long BEAM, But I will be Strong Short #CathieWood
Baught this stock...I analyzed it....and …...well....I would do exact the opposite......
But why?
Technical Analysis
Let forget eveything you know about technical analysis, and let together tell this story....logically..
At
76-71 USD AGGRESSIVE SELLERS FORCED THE PICE DOWN
29,72 USD BUYERS DEFENDED THIS Area(ZONE) as well the sellers took partial profits, and accumulated their positions ,but this time more powerfully and aggressive at 64-61USD zone
THE PRICE MOVED DOWN, Institutional buyers took patial profits,(the best decision they could do OTHERWISE THEY WOULD LOSE ALL THIER PROFITS LOOK AT THE PICE OF TODAY
The retail traders who followed the news and the hype baught Beam hoping that the share prce will fly to the moon,but......
At 64-61 who is waiting there?
YES THE AGGRESSIVE SELLERS!!!!
NOW THEY FORCED MUCH MORE ORDERS TO SEND THE PRICE To the....where we are now....
Bad for the buyers...Some buyers took profits, some took losses, and to compensate thier losses, they started to sell short the market....
At 28,80(YELLOW LINE) we are now at the weak support(low volume) The market could make a retracement to 44,94USD
where the sellers and BEARS are waiting of them.....to do what? Well you know it.....
Otherwise...more selles (former retail trades bulls) could decide to sell the maket from here....
WE HAVE A LONG DISTANCE TO GO DEEPER....
Targets short
13,75
8,68
3,82
1,25
.
.
Wood's flagship ARK Innovation ETF has loaded up in recent weeks on Beam Therapeutics (BEAM 1.11%). The gene-editing stock currently ranks as the ETF's 18th-largest holding. It's also the ninth-largest position in Wood's ARK Genomic Revolution ETF.
Beam Therapeutics is a pioneer in base editing. Most types of gene editing involve double-strand breaks in DNA that can cause random unwanted insertions and deletions. Base editing is highly precise, with no double-strand breaks and no off-target genetic changes. Because of these characteristics, base editing holds tremendous promise as a method for developing therapies targeting genetic diseases and "off the shelf" cell therapies for treating cancer.
So far, Beam has advanced two base-editing candidates into clinical testing. It's evaluating BEAM-101 as a treatment for two rare blood disorders: sickle cell disease and beta-thalassemia. And the company expects to begin dosing patients in a phase 1 study of experimental cancer cell therapy BEAM-201 by mid-2023.
Those two programs could be joined by two others soon. Beam hopes to submit for regulatory approvals to start clinical studies of BEAM-301 as a treatment for glycogen storage disease type 1a and BEAM-302 as a treatment for severe alpha-1 antitrypsin deficiency by early 2024.
The company has a long way to go. But if its base-editing programs prove to be safe and effective, Beam could be a massive winner.

March Gainers (BEAM, account up 1%)2nd gainer in March is BEAM . Holding period is 0 days (3/13/23-3/13/23). Account is up 1%.
This month till today, my account is up 2%
My trading method is mostly short term and is independent of market swings.
Will keep updating on my trades.

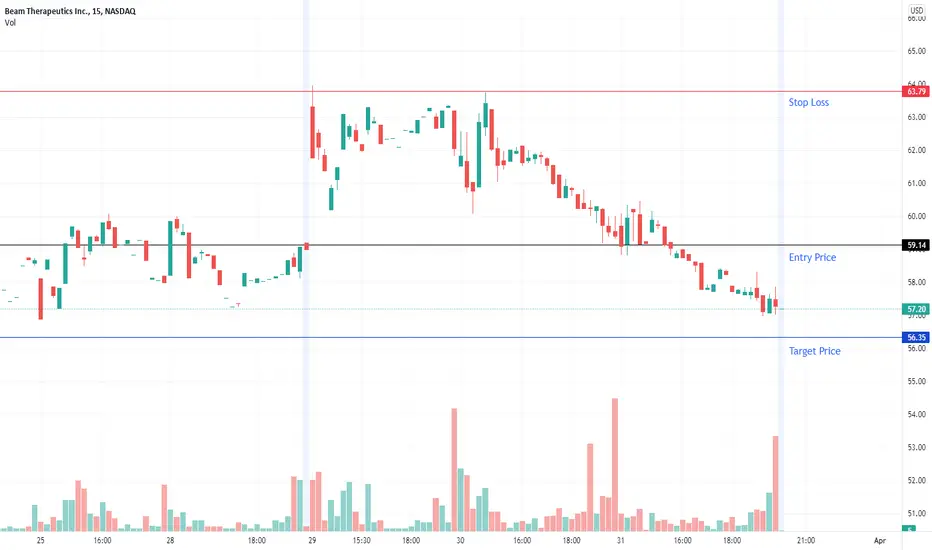
1/4/2022 NASDAQ (BEAM)Short (Entry Price) below the black line and exit (Stop Loss) above the red line. Can take profit at the suggested Target Price.
Entry Price: $59.14
Target Price: $56.35
Stop Loss: $63.79
28/3/2022 NASDAQ (BEAM)Short (Entry Price) below the black line and exit (Stop Loss) above the red line. Can take profit at the suggested Target Price.
Entry Price: $57.83
Target Price: $55.93
Stop Loss: $61.00

24/3/2022 NASDAQ (BEAM)Short (Entry Price) below the black line and exit (Stop Loss) above the red line. Can take profit at the suggested Target Price.
Entry Price: $59.01
Target Price: $57.11
Stop Loss: $62.22

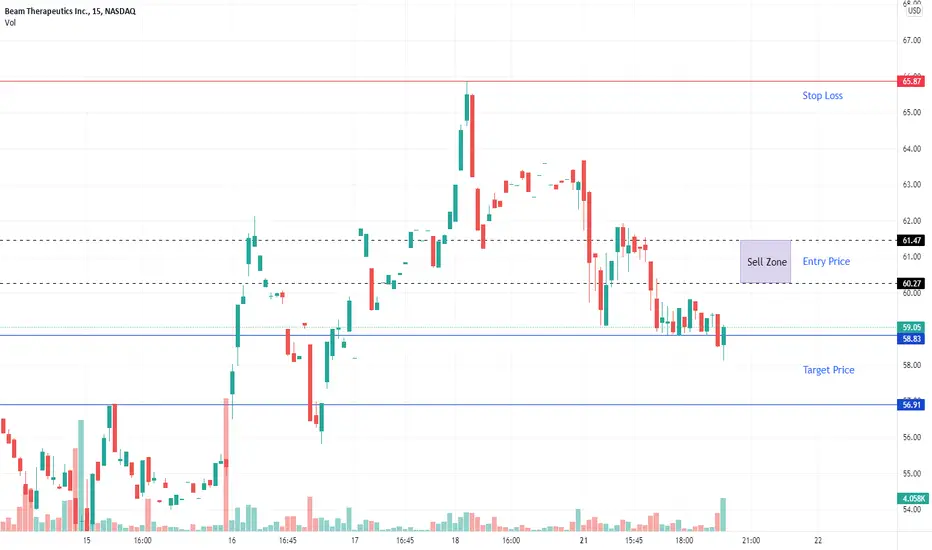
22/3/2022 NASDAQ (BEAM)Short (Entry Price) within the sell zone area and exit (Stop Loss) above the red line. Can take profit at the suggested Target Price.
Entry Price: $61.47 / $60.27
Target Price: $58.83 / $56.91
Stop Loss: $65.87
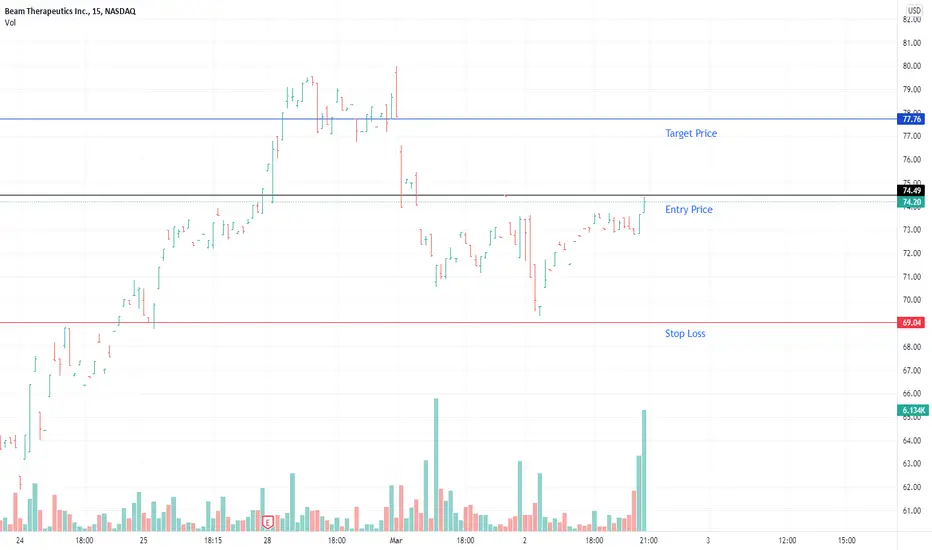
3/3/2022 NASDAQ (BEAM)Buy (Entry Price) above the black line and exit (Stop Loss) below the red line. Can take profit at the suggested Target Price.
Entry Price: $74.49
Target Price: $77.76
Stop Loss: $69.04
Beam me up, Scotty! BEAMWe are not in the business of getting every prediction right, no one ever does and that is not the aim of the game. The Fibonacci targets are highlighted in green with invalidation in red. Fibonacci goals, it is prudent to suggest, are nothing more than mere fractally evident and therefore statistically likely levels that the market will go to. Having said that, the market will always do what it wants and always has a mind of its own. Therefore, none of this is financial advice, so do your own research and rely only on your own analysis. Trading is a true one man sport. Good luck out there and stay safe!

$BEAM at an Interesting Spot$BEAM recovered on earning and after shaking out few traders Friday.
Back on my list. Interesting spot here.

Long $BEAM CMP $110.98Long $BEAM CMP $110.98. Appears to be cup and handle breakout candidate. Must stay above $109-110 for breakout.

$BEAM Base around its 50 MA$BEAM putting in a nice pivot/cheat area at its 50 MA. Keeping my eyes on it this week.


BEAM Trade OpportunityI have been looking for opportunities within some of the holdings of ARKK. Sell side bias given the performance of ARKK's other holdings. Watching.

Is the correction over?We have been seeing a brutal selloff/shorting since mid-February of this year - especially within the genomics sectors, a darling sector for ARKK investments. This is one of their highest conviction names. The chart is indicating a possible near-term bottom per the formation of a long-term trendline and sentiment slowly shifting with more buying volume this week.
