BIDU trade ideas
BIDU - BAIDU INC SPON - NASDAQ Financials well! It's not expensive comparing to its industry.
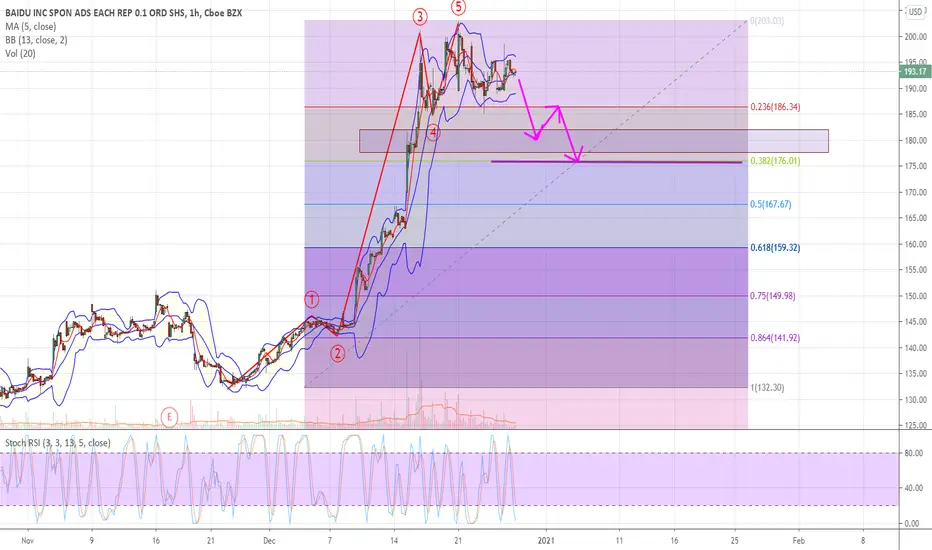
It may wanna rest after touching the up line.
I wish you good profit!
Thanks
Important Notice
- The index, stock, commodity, etc. I share here should not mean that I personally take a position.
- It is important that my shares are not interpreted as buy-hold-sell advice in any way.
-Please process according to your own risk appetite
-You can send me a direct message for your financial, technical or training requests.
- Liking the shares and following the account is an important indicator for the continuation of the shares.
- All the works I have shared; all the information, drawings, graphics and comments, the notes I have taken for myself and / or my experiments on technical analysis , my training notes.
Legal Notice
Investment information, comments and recommendations contained herein are not within the scope of investment consultancy. Investment consultancy service: It is offered within the framework of an investment consultancy agreement to be signed between brokerage houses, portfolio management companies, banks that do not accept deposits and the customer. The comments and recommendations contained herein are based on the personal opinions of those who make comments and recommendations. These views may not be suitable for your financial situation and risk and return preferences. Therefore, making an investment decision based solely on the information contained herein may not produce results in line with your expectations. Nevertheless, I cannot be held responsible for any direct and / or indirect damages, loss of profit, moral damages and damages that may be incurred by third parties, which may be incurred by investors as a result of the use of the information on the site and the resources used for the site

$BIDU Our C&H Target Surpassed, 👏👏🤑🤑 PROFITS BANKED
What a trade this has been , the C&H measured move has now been surpassed,
momentum with the added fuel of FOMO looks like carrying it higher.
It has now entered into a zone off higher volume history but the whether eager sellers await
I am not to sure. Options activity is very high which is also a catalyst to rally.
Resistance levels as per the chart may act as temporary stall zones.
Please keep perspective and bank profits, RSI is getting into lofty territory.

Channel Break Out - BAIDU-Broke out of channel creating a big bag between both 50 and 200 MA.
-Good call credit spread opportunity.
-RSI indicating oversold.
-Stop loss 210 if price continues to increase.

BAIDU (BIDU) May break out of Pennant Pattern SoonCurrently Coiling. See possible lower level of support if pennant fails.


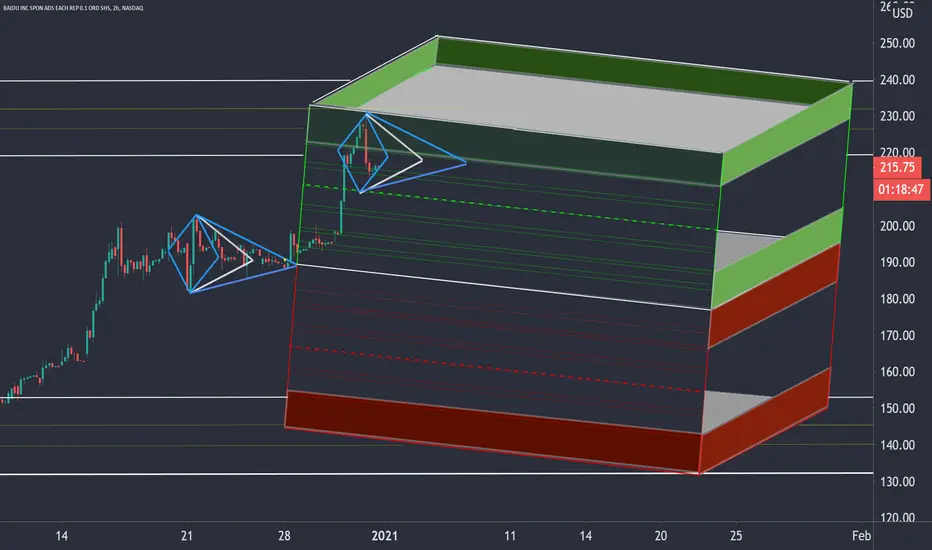
BIDU - Diamond Performance CubeDiamond Patterns, at the top or bottom of impulsive moves, can function as a reversal or continuation patterns, offering large rewards embedded in the uncertainty. . The Diamond Performance Cube is an experimental scenario planning tool designed to identify upside and downside targets (dotted lines) for the diamond pattern. I am scouting a bull back test of the light blue dart for a play to upside.

Live Intraday Trading - A breakout trade !!!Early morning session breakout in Bidu . A very quick scalp .


BIDU Hints at Joining EV Market, Why not Cash In with a Headline
Revised resistance levels for BIDU.
The EV story line will probably carry this higher, rightly or wrongly, but when you
consider Nio has a M/c $20bil large than Bidu it would be justified .
Up 17% from the breakout and the RSI is extended so trade with care and reasonable expectations.
Upside targets $185- $200

$BIDU Cup & Handle Breakout Underway 🤑🤑
Cup and Handle Breakout underway .
Unfortunate your guys on TView missed my alert from earlier this week.
Targets as per the chart.
Volume increased to confirm breakout.


$BIDU #BIDU & Bossible (7) GoalsNASDAQ:BIDU
You must know before anyone else. This stock will rise in the future ..
WATCH breakouts .
7 GOALS ON MY CHART
T1 = 144.362
.
.
T7 = 247.135
It is not impossible .
Remember this .
🤞


BIDU - breakout with multiple upgradesBreaking out. MOMO play to top of the monthly breakdown candle.
PT: $166.25

Cup and Handle Ascending TriangleLooks like BIDU has broken from A triangle and the cup and handle pattern..
Bidu broke neckline of an inverse H&S pattern earlier/see previous chart on BIDU..
Support can be found at handle low (HL) or mid cup which is 114.55..
There should also be support at top trendline of ascending triangle..
Possible rising wedge forming due to lack of touches on trendline..ie.. ? marks..
Buy red sell green
Happy holidays!

BIDU major Reversal?Today BIDU is looking to reclaim major horizontal support/resistance level at $155. This could signify the start of a long trend period.

$BIDU with a slight bearish outlook following earning The PEAD projected a slight berish outlook following $BIDU earning release with a negative under reaction placing the stock in Drift D
If you would like to see the Drift for another stock please message us. Also click on the Like Button if this was useful and follow us or join us.

$BIDU on the move Looking for $148, $150 then $152, it is prone to taking a punch from the news so buyer be ware.
