Expecting more chop in this area for the next month or soBig gap up this morning on BIDU
I think we correct a bit and start to maybe maybe a long term cup and handle on the daily chart
@CuznEddieTrades
BIDU trade ideas

Bye bye BIDUNothing too complicated here. I think the china reopening will be underwhelming for a bit here. More of a technical trade here. BIDU is entering a supply zone and I'm looking to short.

BIDU INC ADRShe can go on and on like erika BIDU.
Similar to Amazon in China.
This company will emerge past the likes of BABA and stay there.
When China runs all eyes on BIDU and possibly JD.
Not too many ticker ADR's in this space will be able to outperform this monster.
BABA had it's shot and misshaps have caused nothing but permanent damage.
-stikstockitslive

$BIDU - Long Trade Idea$BIDU
This ticker popped up on my screener set based on strength.
I am waiting for the break of the downtrend before entering. Target price is 294/295
Latest News: "Chinese Search Giant Baidu to Launch ChatGPT-Style Bot"
www.bloomberg.com

could we see a pullback?I will be looking at this area to see if a pullback forms. RSI on the daily seems to be at peaking levels. On my wave counts I have a 5 wave impulse up, so I'm looking to see a corrective wave down if this count is valid. That being said, this is showing great strength and sitting above 20,50,200 MA.
Thoughts on this?

Watchlist 2023-01-30 #BIDU #JD #RIVN #LCIDSPY gapping below PD open, putting any Friday longs underwater. I think it tests the convergence of the balance are top and the descending trendline around 400 - 401.50. From there, look to see if pops are sold are if they hold, that will tell if we had enough fuel to continue higher or if we need a larger flush out before approaching the 410 area.
BIDU - launching an AI-power chatbot in March. Not only is this the hot topic right now like crypto in 2021, but BIDU is also gapping over a balance area with a prior day bullish hammer. A+ setup if we can hold over 139. No real resistance until 150, and with a 5.0 ATR range is possible this could go that far today if SPY heats up. However, no bias until price actions confirms thesis as other ADRs are gapping down today.
JD - panning to exit sales in exit Thailand and Indonesia market. Sitting on key support at 61. If this can't hold, 58.30 at the 200MA is the next target. To Improve risk reward, better to sell pops in this IMO as long as they fade after and don’t hold.
Watching other ADRs if weakness from PM continues: BEKE, BABA, PPD
RIVN - keeping this on watch over the high volume node at 20.30. Also, past the April 25 2022 key pivot resistance at 19.30. If LCID buyout bullishness continues, RIVN could have a support rally.

Baidu - Not out from the wood yetBaidu climb 62% from Bottom to Top of the channel. Fastest climb in the channel.
Currently at Channle Resistant with nice HLHH uptrend.
Uptrend, Strong Bull and Bullish but volume is declining.
Recent Slow Turtle Buy is with lower volume.
Can monitor for BoD and BoB above downtrendline.
0% Retailer with 79% strong banker.

BIDU Potential for Bullish Continuation | 26th December 2023Looking at the H4 chart, my overall bias for BIDU is bullish due to the current price being above the Ichimoku cloud , indicating a bullish market.
Looking for a buy stop entry at 139.03, where the previous high is to ride the bullish momentum. Stop loss will be at 124.07, where the previous overlap support and 23.6% Fibonacci line is. Take profit will be at 155. 40 , where the previous swing high is.
Any opinions, news, research, analyses, prices, other information, or links to third-party sites contained on this website are provided on an "as-is" basis, as general market commentary, and do not constitute investment advice. The market commentary has not been prepared in accordance with legal requirements designed to promote the independence of investment research, and it is therefore not subject to any prohibition on dealing ahead of dissemination. Although this commentary is not produced by an independent source, FXCM takes all sufficient steps to eliminate or prevent any conflicts of interest arising out of the production and dissemination of this communication. The employees of FXCM commit to acting in the clients' best interests and represent their views without misleading, deceiving, or otherwise impairing the clients' ability to make informed investment decisions. For more information about the FXCM's internal organizational and administrative arrangements for the prevention of conflicts, please refer to the Firms' Managing Conflicts Policy. Please ensure that you read and understand our Full Disclaimer and Liability provision concerning the foregoing Information, which can be accessed on the website.

BIDU Potential for Bullish Continuation | 26th December 2023Looking at the H4 chart, my overall bias for BIDU is bullish due to the current price being above the Ichimoku cloud, indicating a bullish market.
Looking for a buy stop entry at 139.03, where the previous high is to ride the bullish momentum. Stop loss will be at 124.07, where the previous overlap support and 23.6% Fibonacci line is. Take profit will be at 155.40, where the previous swing high is.
Any opinions, news, research, analyses, prices, other information, or links to third-party sites contained on this website are provided on an "as-is" basis, as general market commentary, and do not constitute investment advice. The market commentary has not been prepared in accordance with legal requirements designed to promote the independence of investment research, and it is therefore not subject to any prohibition on dealing ahead of dissemination. Although this commentary is not produced by an independent source, FXCM takes all sufficient steps to eliminate or prevent any conflicts of interest arising out of the production and dissemination of this communication. The employees of FXCM commit to acting in the clients' best interests and represent their views without misleading, deceiving, or otherwise impairing the clients' ability to make informed investment decisions. For more information about the FXCM's internal organizational and administrative arrangements for the prevention of conflicts, please refer to the Firms' Managing Conflicts Policy. Please ensure that you read and understand our Full Disclaimer and Liability provision concerning the foregoing Information, which can be accessed on the website.

BIDU key level BIDU coming off the bottom of a long term Broadening Formation, at a key level that has previously acted as strong demand zone. Could see a nice run back through previous range within the BF. Decent Risk Reward opportunity, options play. #TheStrat @RobInTheBlack @chuckthetrader

Baidu Potential for Bullish Continuation| 19th January 2023Looking at the Daily chart , my overall bias for BIDU is bullish due to the current price being above the Ichimoku cloud , indicating a bullish market. Looking for a pullback buy entry at 124.11, where the overlap support and 50% Fibonacci line is. Stop loss will be at 107.23, where the recent swing low and 38.2% Fibonacci line is. Take profit will be at 155.48, where the previous swing high is.
Any opinions, news, research, analyses, prices, other information, or links to third-party sites contained on this website are provided on an "as-is" basis, as general market commentary, and do not constitute investment advice. The market commentary has not been prepared in accordance with legal requirements designed to promote the independence of investment research, and it is therefore not subject to any prohibition on dealing ahead of dissemination. Although this commentary is not produced by an independent source, FXCM takes all sufficient steps to eliminate or prevent any conflicts of interest arising out of the production and dissemination of this communication. The employees of FXCM commit to acting in the clients' best interests and represent their views without misleading, deceiving, or otherwise impairing the clients' ability to make informed investment decisions. For more information about the FXCM's internal organizational and administrative arrangements for the prevention of conflicts, please refer to the Firms' Managing Conflicts Policy. Please ensure that you read and understand our Full Disclaimer and Liability provision concerning the foregoing Information, which can be accessed on the website.

BIDU daily - possible breakdown BIDU is more bearing than bullish fundamental stock, therefore we would trade it mostly on a short position.
BIDU daily is in a big up channel with a high possibility of channel breakout. Price went into the area of resistance and got rejected.
Volume is ticking much higher on price fall which is bearish.
RSI after strong divergences starts to fall further.
MACD histogram ticks red while the MACD line cross over the signal line which is a bearish signal.
Overall: BIDU is at major resistance of the blue trend line and BigRed 200 days MA and 20 days MA which should act as support. In case they don't, and the price of BIDU continue to accelerate it will be extremely bearish for price and we would enter a short position. Entry would be when the price cross on a bigger volume or close day below BigRed, 20 days MA, or a blue dotted line.
On the other side, if BIDU bounces from this support with resistance would be at 140 where it would create new negative/bearish divergences which would indicate a possible drop.

Possibilities for $BIDU, LongTerm HoldsJust random charting I did for $BIDU for possible long positions expiring in Q1 2026

PennantPrice has broken up from the pennant.
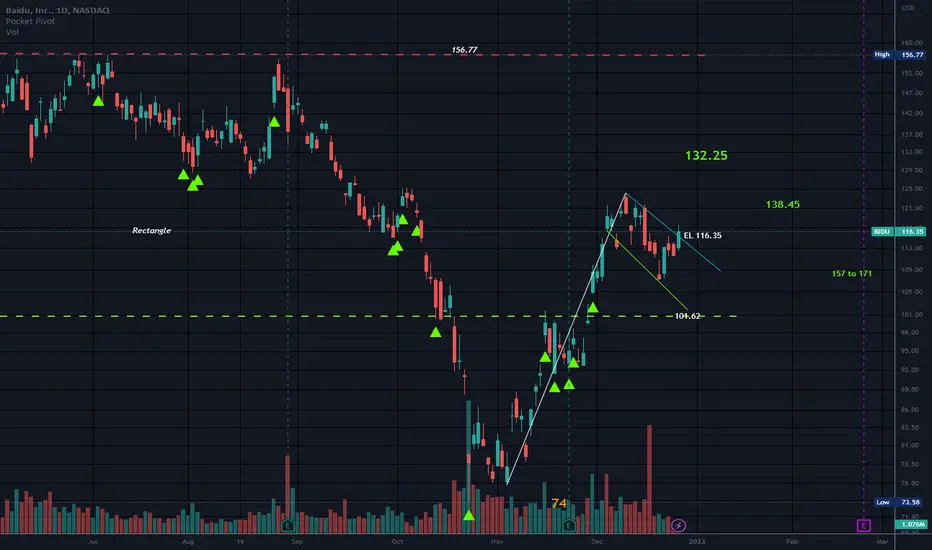
Remains inside a Rectangle.
Earnings 2-23 BMO
EPS (FWD)
8.56
PE (FWD)
13.92
Div Rate (TTM)
-
Short Interest
3.12%
Market Cap
$41.16B
No recommendation


$BIDU long ideaHello dear Traders,
Here is my idea for #BIDU
Price closed above yellow line (previous month high)
Targets marked in the chart (green lines)
Invalidation level marked with red line
Good luck!
❤️Please feel free to ask any question in comments. I will try to answer all! Thank you.
Please, support my work with like, thank you!❤️

Bull FlagPrice is at the resistance line of the flag.
Long when entry level met.
Baidu, Inc. offers internet search services in China. It operates through Baidu Core and iQIYI segments. The company offers Baidu App to access search, feed, and other services using mobile devices; Baidu Search to access its search and other services; Baidu Feed that provides users with personalized timeline based on their demographics and interests; and Haokan, a short video app. It also provides Baidu Knows, an online community where users can ask questions to other users; Baidu Wiki; Baidu Healthcare Wiki; Baidu Wenku; Baidu Scholar; Baidu Experience; Baidu Post; Baidu Maps, a voice-enabled mobile app that provides travel-related services; Baidu Drive; Baijiahao; and DuerOS, a smart assistant platform. In addition, it offers online marketing services, which include pay for performance, an auction-based services that allow customers to bid for priority placement of paid sponsored links and reach users who search for information related to their products or services; other marketing services that include display-based marketing services and other online marketing services based on performance criteria other than cost per click; mobile ecosystem, a portfolio of apps, including Baidu App, Haokan, and Baidu Post; various cloud services and solutions, such as platform as a service, software as a service, and infrastructure as a service; self-driving services, including maps, automated valet parking, autonomous navigation pilot, electric vehicles, and robo-taxi fleets, as well as Xiaodu smart devices. Further, the company provides iQIYI, AN online entertainment service, including original and licensed content; other video content and membership; and online advertising services. Baidu, Inc. has strategic partnership with Zhejiang Geely Holding Group. The company was formerly known as Baidu.com, Inc. Baidu, Inc. was incorporated in 2000 and is headquartered in Beijing, China.
No recommendation
BIDUMakes things easier when Fibs & supply/demand zones line up. Rejecting weekly supply zone/0.618 retracement from the c0vid crash. Looking for a test of weekly demand zone, which also lines up with the 0.618 retracement of the recent rally. I'm short via BIDU puts as well as YANG shares.

BIDU | Oversold Conditions | Good EntryBaidu, Inc. offers internet search services in China. It operates through Baidu Core and iQIYI segments. The company offers Baidu App to access search, feed, and other services using mobile devices; Baidu Search to access its search and other services; Baidu Feed that provides users with personalized timeline based on their demographics and interests; and Haokan, a short video app. It also provides Baidu Knows, an online community where users can ask questions to other users; Baidu Wiki; Baidu Healthcare Wiki; Baidu Wenku; Baidu Scholar; Baidu Experience; Baidu Post; Baidu Maps, a voice-enabled mobile app that provides travel-related services; Baidu Drive; Baijiahao; and DuerOS, a smart assistant platform. In addition, it offers online marketing services, which include pay for performance, an auction-based services that allow customers to bid for priority placement of paid sponsored links and reach users who search for information related to their products or services; other marketing services that include display-based marketing services and other online marketing services based on performance criteria other than cost per click; mobile ecosystem, a portfolio of apps, including Baidu App, Haokan, and Baidu Post; various cloud services and solutions, such as platform as a service, software as a service, and infrastructure as a service; self-driving services, including maps, automated valet parking, autonomous navigation pilot, electric vehicles, and robotaxi fleets, as well as Xiaodu smart devices. Further, the company provides iQIYI, AN online entertainment service, including original and licensed content; other video content and membership; and online advertising services. Baidu, Inc. has strategic partnership with Zhejiang Geely Holding Group. The company was formerly known as Baidu.com, Inc. Baidu, Inc. was incorporated in 2000 and is headquartered in Beijing, China.

BIDU Baidu Options Ahead Of EarningsIf you haven`t sold BIDU here:
Then you should know that looking at the BIDU Baidu options chain ahead of earnings , i would buy the $105 strike price Calls with
2022-12-16 expiration date for about
$4.75 premium.
If the options turn out to be profitable Before the earnings release, i would sell at least 50%.
Looking forward to read your opinion about it.

Baidu: Right-Angled and Ascending Broadening FormationWe have a confirmed partial rise within this formation and the next step would be to break down to the last levels of interest between the 0.786 and 0.886 retraces.

China Stocks/BIDU/NTES Deeply Oversold.
Oversold conditions can persist for extended periods of time.
No recommendation.
BIDU fell from a Rectangle.
Both are Under a red cloud.
Both are under the bands.
Target 1 for BIDU's Rectangle has been met met.
Conflicting earnings dates but appears to be late November for both

$BIDU with a Bearish outlook following its earnings #Stocks The PEAD projected a Bearish outlook for $BIDU after a Negative over reaction following its earnings release placing the stock in drift C.
