$BLINK 4h Rotation into EnergyScanning through the heat map looks like we're rotating into energy and the dow has moved bearish to bullish. Calls above 53.28 on $BLNK looks great for an entry.
BLNK trade ideas

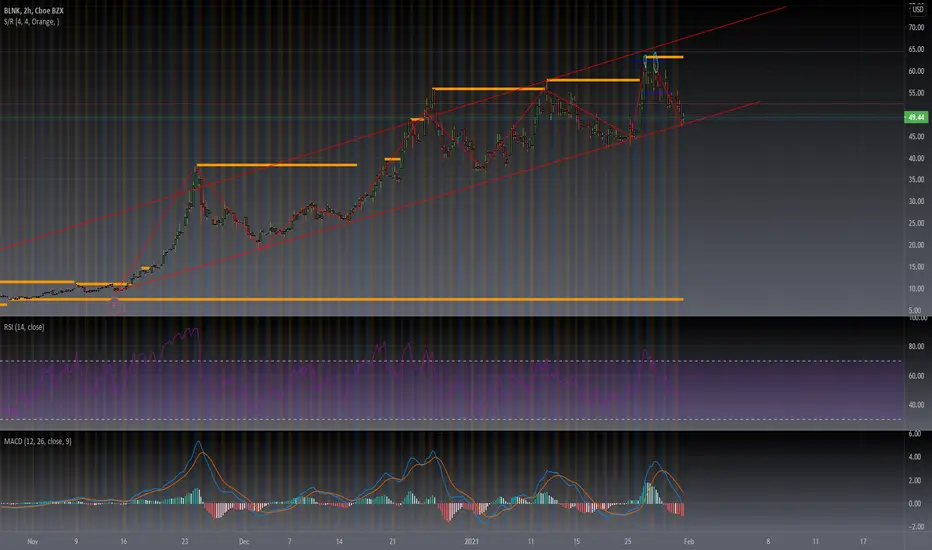
Ascending Triangle for higher highsHi Guys, first time making a publish and wanted to get some feedback.
Looks like we have resistance at 53.31 on the daily chart time frame.
I have mapped out a strong Ascending triangle coupled with a Ascending Channel.
Either tomorrow or sometime next week we could see a dip and and strong rise for higher highs.
Can expect a resistance at at the ATH around 64.50 but coupled with ascending a triangle I can see it testing new highs.
NASDAQ:BLNK TSXV:BLN NASDAQ:BLNK SET:B

$BLNK Sets Up the Pullback Long$BLNK lines up the classic "pullback long" setup as a leadership name in the leadership EV space.


BLNK, i made this a few days ago. its accurate so maybe you guysi have used trend lines and a pattern to make my prediction,
the bollinger end MACD indicators are also verry good.


#BLNK Acending Triangle - BLNK After a hard fake outsell off BLNK found support on a strong trendline creating a textbook acending traingle, or abcde correction looking like like i said a textbook traingle acbde following rules with E being a common fakeout.
- Energy overall this year looks extremely bullish as well strong support with the EMA and the powerful Cloud long with a trendline.
- As energy sector been correcting its been looking like signals of reversal here soon for a explosive move to the upside keep it on watch!

BLNK longBLNK has held the 20ma nicely, displayed strength going from red to green today. Target 60+


$BLNK #BLNKI like this stock to be honest, not an investment advice.
Twitter @Juancalderont for more charts idea

💡$BLNK 🔌3,500% and then some more?💰+30%🏌️♂️📖 Blink Charging is an electric vehicle infrastructure company based in Florida. Blink Charging owns and operates an electric vehicle (EV) charging network and offers related services. It also operates its proprietary cloud service Blink Network accessible via a dedicated mobile application. Blink has recently entered an agreement with Lion Electric - who are making electric school busses - meaning Blink will offer its full line of charging stations to the school systems and bus fleets that utilize the company's all-electric school buses. However, CEO Michael Farkas recently sold 540,000 shares of common stock at just $41 each causing the price to tumble. Blinks revenue doubled last year compared to the year previous. Despite $4.5 million in trailing revenue, it is fetching a market cap of nearly $2 billion, a whopping 435 times its top line. This will scare some investors, but on the other hand, puts Blink in a good position to use this capital to acquire other companies. If 2020 was anything to go by, this stock is subject to volatile swings, in both directions.
📈 BLNK is currently 25% down from its all time highs. Price has been trading in a bullish price channel since early December last year. Price has recently completed a 0.5-0.618 Fibonacci retracement from its 5th Jan wing low and 2th Jan swing high, highlighted by the blue box. This event has also coincided with a touch of the supporting price channel. Price is also supported by the 50 MA. Furthermore, yesterday's 4H candle close was a gravestone doji, a reversal candlestick. Price on lower time frames (1H) is still bearish, so one should wait for a clear candle that shows sign of price strength. Low risk, high reward but the stock in the past has been volatile.
🔎This is not financial advice. Always do your own research and due diligence. Always wait for directional confirmation before entering a trade.


Same BLNK analysis on a 1h time frametwo price targets. Wait for confirmation to go long. Maybe a hammer, dragonfly dojo, double bottom, triangles, etc. If price breaks that intermediate resistance level, price will most likely continue to fall and respect the major support level.

BLNK,What is the RSI and Volume both telling us?BLNK is already on an uptrend. Recently price has been in somewhat of a sideways move, Still making higher highs and higher lows (uptrend). I noticed a pattern where volume contracts and RSI contracting right before another leg up to make another new High. Where price currently is, we see another contraction with volume and RSI. As far as market structure, We are at an intermediate resistance level, I would wait for some kind of chart/candlestick pattern for a long confirmation. Overall this is looking like nice swing trade to the upside, or some $58 calls.

$BLNK falling wedge$BLNK- Bullish falling wedge, breakout soon. Looks like another 1-3 days down to set up this falling wedge and then a breakout to price target $66. Observation: Notice how the angle and length of the wedges have decreased each time, and the rest between each support has decreased each time also. I’m wondering if this next breakout and sharp return to support forms a double top reversal pattern leading to a break from regression channel support and down to sideways action or a downward trend until another major catalyst

BLNK PTs Accomplished✅ Congrats guys!! All 3 PT zones hit. We almost hit the top to the penny as well. Amazing trade overall hope y'all banked on it. On this play the contracts went way over 1000%!! Enjoy :)

BLNK : 3 OPTIONS moving higher (SHORT & MID-TERM)YELLOW PATH = FLAT correction, .
ORANGE PATH = TRIANGLE correction, .
GREEN PATH = ENDING DIAGONAL, .

blink will most likely fall after todays runblink has been in a nice channel for awhile after every good run ive it likes to pull back. im buying 160 puts
