The Case For BumbleBumble has a yearly gross profit of 693M. Last year they repurchased 310M worth of stock.
Bumble at 5.64/share means it's entire market cap would be 610M or 80M less than one year's worth of profit. I don't understand how anyone could sell BMBL this low.
So while I'm not in love with BMBL's revenue growth, it's pretty clear this stock is significantly undervalued. 5.35 would be my buy target on support.
I'm interested to hear anyone else's take.
Good luck!
BMBL trade ideas

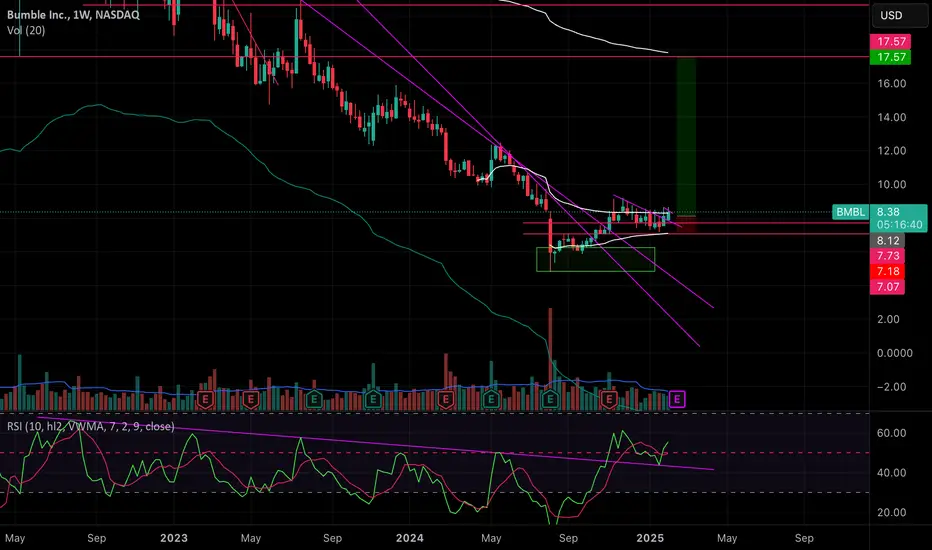
Bumble looking bullish above the 200MABumble looks to be consolidating just above the white line which is the 200MA. It hasn't traded above the 200 since its IPO in Feb 2021. If the 200 holds, look for much higher prices for bumble! I bought the Jan 26' $6 Calls for $1.50

BMBL Bumble Options Ahead of EarningsAnalyzing the options chain and the chart patterns of BMBL Bumble prior to the earnings report this week,
I would consider purchasing the 8usd strike price Calls with
an expiration date of 2025-4-17,
for a premium of approximately $1.52.
If these options prove to be profitable prior to the earnings release, I would sell at least half of them.

Long AFLooong bumble, they have already sat the boottom with the bad write down last earnings
Long term bottom and negative RSI has been broken and stock will follow
I see this as a short term 2X play
Lets hope that this earnings the 18 is OK
Bumble | BMBL | Long at $8.34Arguably, Bumble NASDAQ:BMBL , Match NASDAQ:MTCH , and Grindr NYSE:GRND have an enormous amount of *highly* valuable data on its past and current users. Like any industry, it often simply takes time for this recognition by market makers to occur before price aligns with the "true" future value. If you are an AGI company looking to enhance user companionship with machines and AI bots, these companies hold the keys.
NASDAQ:BMBL has low debt, paying users are still growing (caution if recession begins), and revenue is rising. Personally, the value is in the company's data.
From a technical analysis perspective, my historical simple moving average lines are working their way toward the price. Often, this means a rise in price as the lines flatten and then inevitably rise with the trend reversal. However, I would not be surprised if there were some shakeouts in the near-term if the price suddenly dropped near $5 post-earnings, etc. Regardless, it will personally likely be an opportunity to gather more shares. Thus, at $8.34, NASDAQ:BMBL is in a personal buy-zone.
Target #1 = $12.00
Target #2 = $15.00
Target #3 = $22.00

One of the best setups for high r/r's out there right nowIn a 2 year long descending wedge, RSI grinding up higher while price is essentially consolidating, barely making lower lows. This is due for a run eventually. Buying right now has good R/R with 3-5% stop loss minimum 12% gains on test of upper resistance area of triangle. Legit one of the easiest money making opportunities out there in this moment in time.

I see long term broadening wedge on weekly, I buy strong r/r for a bounce, can easily define exits and high % of mean reversion trade. GL

Bumble ready to fly like a bee? Or continue it’s descent to zeroSomething is brewing in the charts. The trend remains down pre earnings but Fibonacci time suggests we could get a volatile move. Perhaps a short squeeze in the offing. Fib time will tell…

BMBL – When Will The Bleeding Stop?NASDAQ:BMBL has been in a strong downtrend since launch, and could potentially rebound at some point. I personally prefer to stay away from these types of charts, but if they start showing some bullishness maybe there could be a trade setup later. The price is trading near the lows of the range for anyone who wants to take a shorter term trade, I’m personally just looking for better opportunities.

BMBL Bumble. Down 85% From IPOBumble.com The Social media Connecting / Interacting Company which I'm sure we all know is a Break Away from Match.com
No need to say the Trend, the Chart depicts all.
However, there could be a longer Trend reversal due to the new GLP1 weight loss drugs.
The idea is - should these drugs become more popular and people lose weight, go to gym and get healthier, they will also then start Dating more - therefore start using their APP.
I would wait to see a defined IMACD reversal before entering, and then only a small position.
As always, please get a few outside Expert's Advice before taking Trade or Investment decisions.
If you appreciate my Chart Studies, Smash That Rocket Boost Button. It's Just a Click away.
Regards Graham Hitchcox

Bumble Posing Positive Returns Despite Current Market Trend Bumble shows weak development in a falling trend channel in the medium long term. Falling trends indicate that the company experiences negative development and falling buy interest among investors.
An inverse head and shoulders formation, however, is under development. A decisive break of the resistance at $15.15, ideally with an increase in volume, signals a further rise. The stock is testing resistance at dollar 15.30. This could give a negative reaction, but an upward breakthrough of dollar $15.30 means a positive signal.

Hidden Bullish Divergence Potential Short-Term Long OpportunityIntroduction:
This technical analysis focuses on the 4-hour (4H) chart of Bumble Inc. NASDAQ:BMBL and identifies a prominent hidden bullish divergence confirmation. The analysis aims to provide insights for short-term traders seeking potential long positions. Notably, a strong resistance level at 19.95 adds significance to the analysis, as a successful breach beyond this level may indicate the possibility of further upward momentum, potentially leading the stock towards its next major resistance level at 28.12. The clarity and strength of the hidden divergence confirmation make it a noteworthy indicator for traders considering a perfect long position in NASDAQ:BMBL
Hidden Bullish Divergence Confirmation:
On the 4H chart of NASDAQ:BMBL , a clear and robust hidden bullish divergence confirmation is observed. Unlike regular bullish divergences, hidden divergences occur when the stock price forms a higher low, while the accompanying technical indicator, such as the Relative Strength Index (RSI) or Moving Average Convergence Divergence (MACD), forms a lower low. This divergence suggests that despite the stock's lower low, the underlying buying pressure is increasing, indicating a potential bullish trend continuation. Traders often use hidden divergence patterns to identify opportunities for short-term long positions.
Strong Resistance at 19.95:
The 4H chart reveals the presence of a strong resistance level at 19.95. Historically, the price has encountered significant selling pressure at this level, resulting in pullbacks or periods of consolidation. Therefore, this resistance level becomes a pivotal point for traders to monitor closely. A successful breakout above 19.95 could signify a shift in market sentiment and a surge in buying activity, potentially leading to further short-term gains.
Upside Potential:
Should NASDAQ:BMBL surpass the resistance at 19.95, the analysis suggests a possibility of further upside potential with the stock aiming towards the next major resistance level at 28.12. While this level may pose another significant challenge, a successful breach beyond it would indicate considerable strength in the upward trend. Traders may consider capitalizing on this potential momentum for further profits.
Conclusion:
In conclusion, the 4H chart of NASDAQ:BMBL exhibits a compelling hidden bullish divergence confirmation, suggesting a potential short-term long opportunity. The existence of a strong resistance level at 19.95 adds importance to the analysis, as a successful breakout beyond this level could pave the way for further upward movement towards the next major resistance at 28.12. Traders should diligently observe price action and key technical indicators to assess the strength of the trend before considering a long position. As with any trading decision, risk management and consideration of other relevant market factors remain essential for prudent decision-making.

Will you be my friend BMBL?NASDAQ:BMBL
I do have a position, I am treating it as my standard "3% and Run" aproach.
Before earnings play or a more potential run up to earnings.
Entry - 18.57
3% - 19.14
PT - 19.40-19.80 - it will be in Fair Value Gap, so I will be happy with taking profits there.
Stop - 17.90
SMI is curling and RSI is a nice 51. Williams %R which I did start to use as a "fast" RSI is in divergence with previous low. MACD is starting to curl. Charting done on 1D, but 4H has also some momentum. Short time trade.
It is my B+ trade, so I will be watching it quite close. I do not plan to hold it through earnings.

SHORT BMBLFeb 17 25.00 puts. Looking for a spike pre market to add 20 contracts. Such a garbage company and grossly overvalued at 4.89B!

May Gainers (BMBL, account up 0.5%)2nd trade in May is NASDAQ:BMBL .
Holding period is 17 days (4/14/23 - 5/1/23).
Account is up 0.5%.
Total return in May is 0.33%.


BMBL Bullish ConfluenceWe see higher lows since March and the ADX at 26 indicates the start of a strong trend.
The Force Index curling up shows building momentum. Price tested the .38 fibonacci level and closed just under the descending weekly trend line closing as a bullish pin bar.
In addition the 20 EMA is crossing the 200 MA and the 50 MA is rising and will likely form a " golden cross".
The confluence of all these bullish signals points to a rally.
target $41.95, $46.72

BMBL breaking trend supports ❔a clean break of support can lead to a big selloff in my opinion, watching for break of 31.39 for puts / break above 36.47 for calls

BMBL - Weekly Long SqueezeBMBL - Currently in a weekly uptrend, would like to see s/r zone hold for continuation.
If s/r is lost as support then I expect a move to test it as resistance.
Interested to see if this long squeeze plays out, targets are in orange.

US Stock In Play: $BMBL$BMBL - Technology | Software - Application
probably the weakest of the lot I shared today as this only came to my attention today.
but anything with YTD RS high, above all KMA with 3 months base pattern will definitely be in my WL.

$BMBLGreat RS relative to the market, breaking out from wedge. Above 200d sma, 50d sma, 20d ema, 10d ema, with pocket pivots

Queen Bee & the Gap. Path to TargetThis has been trading nicely and I wanted to post a most likely path to target from here:
** Initial Target 47 by July 15, 2022
If you're playing the options you might be interested in how it will get to 47. There are a few factors at play here from a technical perspective that make the probability of success here very high.
- I don't use bollinger bands often but they have their utility for gauging explosive breakouts from narrow ranges, and for continuation plays (BMBL is the latter)
- The purple downtrend lines represent resistance (solid = has yet to be tested/broken, dashed = recently broken)
- The black rectangular boxes are price consolidation zones around critical levels, the 9 day sma is used here as a timing mechanism, and the RSI is useful for gauging the strength of the momentum
- the horizontal red dashed line is something I call a capitulation zone (defined by a run of consecutive (>=5) red bars, highlighted oval); the orange dotted line is the gap boundaries
Back in March there was a failed break of resistance due to momentum not being strong enough - my interpretation is lack of quality of share ownership at the time AKA weak hands. The technical signal that this was going to drop from there was RSI cross bearish and the 9 day ma falling out of the consolidation zone.
Following this failure to breakout there was a capitulation period where those weak hands were taken out aggressively. In May the price exited the cap zone under new ownership (strong hands) and the risk of selling pressure on next breakout attempt was reduced significantly. It formed a new consolidation zone right around the downtrend resistance and broke out when the 9 day moving average exited the top of the consolidation zone (RSI was also in good form).
Now BMBL can ride support up to test the next downtrend resistance just below the gap. The path I drew in is what I am expecting to see in the price action (i.e. price will be in the next consolidation zone around June 17 and attempt to repeat what happened on the recent breakout). This time it will need to have the volatility going into the consolidation zone to put buying pressure on both the overhead resistance and the gap - otherwise its out of the frying pan and into the fire... BMBL has this based on the bollinger. What I want to see is RSI (purple) and its moving average (yellow) get tangled up above 70 - that is a true sign of strength (don't mistake that for oversold, it actually needs that kind of momentum to truly breakout and fill that gap).
Based on time series model that I adjusted for the expected intermittent consolidation period, my time to initial target of 47 is by July 15.
I am personally in the July 15 35.00 calls, but this ain't financial advice. Also, I say "initial target" because I will have to re-assess based on how it trades around the gap. Long term I think this goes a lot higher.
Best,
George Sand

Bumble | BMBL | Short to Gap FillBumble ( NASDAQ:BMBL ) jumped well over +40% on an earnings miss... While it may have "new news" life in the coming days as analysts slash their targets and headlines declare "stock can surge nearly 200%" (source: CNBC)... it is likely to fill the gap or partially fill the gap below ($17.13 to $29.28) before truly making a *long-term* move higher. If the rally continues this week, though, it may test $25.50 or could go as high as $28 (50 EMA) or even $29.50 (near the resistance of the falling wedge). Regardless, the March 2022 Fed meeting and OpEx are next week. I can see the rally news fading rather quickly and this correcting to fill or partially fill the gap in March or perhaps early April.
Q4 2021 Earnings Details: (source: Google Financials)
Paying users = 2.98 million (Estimate of 3 million)
EPS = $0.02 (Expected = $0.10, Surprise = -76.92%)
Revenue = $208.22M (Expected= $209.18M, Surprise -0.46%)
While Bumble and Match likely have great futures and long-term growth in the dating world, it's possible the Bumble post-earnings rally is only temporary.
