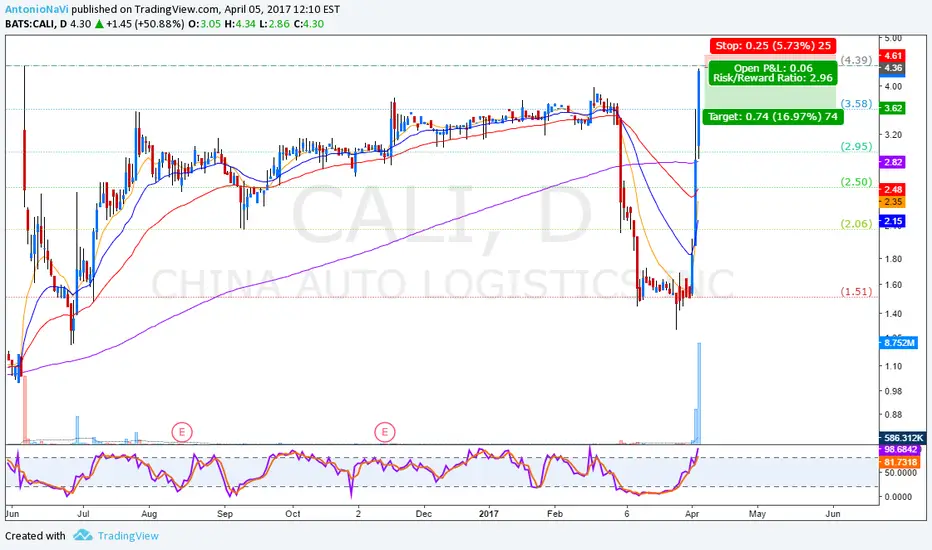
$CALI is interesting. Still reading more between 2016 - 2018Market cap of $14Mn only? Something is off here..
Key stats
About iShares Short-Term California Muni Active ETF
Home page
Inception date
Jul 11, 2023
Structure
Open-Ended Fund
Replication method
Physical
Dividend treatment
Distributes
Distribution tax treatment
Ordinary income
Income tax type
Capital Gains
Max ST capital gains rate
39.60%
Max LT capital gains rate
20.00%
Primary advisor
BlackRock Fund Advisors
Distributor
BlackRock Investments LLC
CALI actively invests in a portfolio of fixed and floating-rate municipal securities, including Muni bonds, municipal notes, and variable rate demand obligations, all issued in the State of California. It seeks tax-exempt income while aiming to reduce tax obligations and manage interest rate risk. To achieve this, the fund holds short-term, USD-denominated securities with investment grade rating, and remaining maturities of 5 years or less. On the other hand, it expects an effective portfolio duration of no more than 1.5 years and targets a weighted average maturity of less than three years. The fund is actively managed, which means investment decisions are at the discretion of the manager and it may also have a higher degree of portfolio turnover than an index-tracking fund. Prior to October 10, 2024, the fund used Blackrock for branding purposes instead of iShares and had a ticker of CALY.
Related funds
Classification
What's in the fund
Exposure type
Municipal
Bonds, Cash & Other100.00%
Municipal96.11%
Cash2.80%
Mutual fund1.09%
Top 10 holdings

Class-Action lawsuit 'potentially' may make this sky-rocket.Lawsuit via BARNA, soon to be issued starting April 9th, claims that $CALI has 35x times the current assets NOT kept with the company.
If the lawsuit wins there's a potential upside that $CALI goes to $102's / $103's per share.
If there's a settlement, then say 50% of this, then $CALI is in $50's


See all ideas
Summarizing what the indicators are suggesting.
Oscillators
Neutral
SellBuy
Strong sellStrong buy
Strong sellSellNeutralBuyStrong buy
Oscillators
Neutral
SellBuy
Strong sellStrong buy
Strong sellSellNeutralBuyStrong buy
Summary
Neutral
SellBuy
Strong sellStrong buy
Strong sellSellNeutralBuyStrong buy
Summary
Neutral
SellBuy
Strong sellStrong buy
Strong sellSellNeutralBuyStrong buy
Summary
Neutral
SellBuy
Strong sellStrong buy
Strong sellSellNeutralBuyStrong buy
Moving Averages
Neutral
SellBuy
Strong sellStrong buy
Strong sellSellNeutralBuyStrong buy
Moving Averages
Neutral
SellBuy
Strong sellStrong buy
Strong sellSellNeutralBuyStrong buy
Displays a symbol's price movements over previous years to identify recurring trends.
Frequently Asked Questions
An exchange-traded fund (ETF) is a collection of assets (stocks, bonds, commodities, etc.) that track an underlying index and can be bought on an exchange like individual stocks.
CALI trades at 50.51 USD today, its price has risen 0.01% in the past 24 hours. Track more dynamics on CALI price chart.
CALI net asset value is 50.45 today — it's risen 0.47% over the past month. NAV represents the total value of the fund's assets less liabilities and serves as a gauge of the fund's performance.
CALI assets under management is 133.69 M USD. AUM is an important metric as it reflects the fund's size and can serve as a gauge of how successful the fund is in attracting investors, which, in its turn, can influence decision-making.
CALI price has risen by 0.25% over the last month, and its yearly performance shows a 0.43% increase. See more dynamics on CALI price chart.
NAV returns, another gauge of an ETF dynamics, have risen by 0.47% over the last month, showed a 1.37% increase in three-month performance and has increased by 3.24% in a year.
NAV returns, another gauge of an ETF dynamics, have risen by 0.47% over the last month, showed a 1.37% increase in three-month performance and has increased by 3.24% in a year.
CALI fund flows account for 100.41 M USD (1 year). Many traders use this metric to get insight into investors' sentiment and evaluate whether it's time to buy or sell the fund.
Since ETFs work like an individual stock, they can be bought and sold on exchanges (e.g. NASDAQ, NYSE, EURONEXT). As it happens with stocks, you need to select a brokerage to access trading. Explore our list of available brokers to find the one to help execute your strategies. Don't forget to do your research before getting to trading. Explore ETFs metrics in our ETF screener to find a reliable opportunity.
CALI invests in bonds. See more details in our Analysis section.
CALI expense ratio is 0.20%. It's an important metric for helping traders understand the fund's operating costs relative to assets and how expensive it would be to hold the fund.
No, CALI isn't leveraged, meaning it doesn't use borrowings or financial derivatives to magnify the performance of the underlying assets or index it follows.
In some ways, ETFs are safe investments, but in a broader sense, they're not safer than any other asset, so it's crucial to analyze a fund before investing. But if your research gives a vague answer, you can always refer to technical analysis.
Today, CALI technical analysis shows the strong buy rating and its 1-week rating is strong buy. Since market conditions are prone to changes, it's worth looking a bit further into the future — according to the 1-month rating CALI shows the strong buy signal. See more of CALI technicals for a more comprehensive analysis.
Today, CALI technical analysis shows the strong buy rating and its 1-week rating is strong buy. Since market conditions are prone to changes, it's worth looking a bit further into the future — according to the 1-month rating CALI shows the strong buy signal. See more of CALI technicals for a more comprehensive analysis.
Yes, CALI pays dividends to its holders with the dividend yield of 2.79%.
CALI trades at a premium (0.11%).
Premium/discount to NAV expresses the difference between the ETF’s price and its NAV value. A positive percentage indicates a premium, meaning the ETF trades at a higher price than the calculated NAV. Conversely, a negative percentage indicates a discount, suggesting the ETF trades at a lower price than NAV.
Premium/discount to NAV expresses the difference between the ETF’s price and its NAV value. A positive percentage indicates a premium, meaning the ETF trades at a higher price than the calculated NAV. Conversely, a negative percentage indicates a discount, suggesting the ETF trades at a lower price than NAV.
CALI shares are issued by BlackRock, Inc.
CALI follows the No Underlying Index. ETFs usually track some benchmark seeking to replicate its performance and guide asset selection and objectives.
The fund started trading on Jul 11, 2023.
The fund's management style is active, aiming to outperform its benchmark index by actively selecting and adjusting assets. The goal is to achieve returns that exceed those of the index the fund tracks.