CFLT: Bullish Momentum Breakout Targeting $29.76 – Strong R/R Ticker: NASDAQ:CFLT (Confluent, Inc.)
Bias: Long
Timeframe: Daily (with momentum building from May lows)
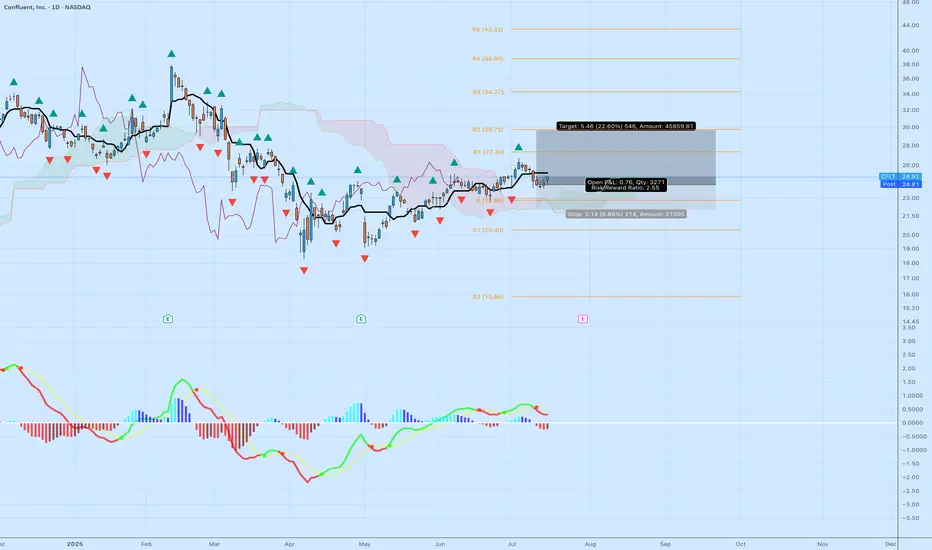
Entry: Around $24.30 (near recent breakout above pivot at $22.80)
Stop Loss: $22.14 (below swing lows, ~8.86% risk)
Target: $29.76 (near R2 resistance, ~22.60% reward)
Risk/Reward Ratio: 2.35:1
Position Sizing Suggestion: Limit risk to 1-2% of capital (e.g., ~$21,000 total risk on 3,271 shares as shown)
Confluent (CFLT) is showing strong bullish momentum on the daily chart, breaking out from a multi-month consolidation base between $18–$23 since April 2025 lows. The price has formed higher highs and lows, supported by a bullish MACD crossover (green signal line above red, positive histogram bars), indicating accelerating upside potential. RSI is neutral around 54–60, leaving room to run without being overbought. Volume has ticked up on recent green candles, confirming buyer interest.
From a smart money perspective, institutional ownership stands at ~78%, with net buying in Q2 2025 (e.g., hedge funds adding ~7.1M shares). This aligns with Confluent's growth in real-time data streaming for AI and cloud applications, boosted by the July 2025 AWS Marketplace expansion for AI agents. Fundamentals support this: Q1 2025 beat expectations (EPS $0.08 vs. $0.07, revenue +26% YoY, Cloud segment +42%), though guidance was conservative amid macro IT spending slowdowns.
Pivot points guide the trade: Break above P ($22.80) targets R1 ($27.33) then R2 ($29.73, close to my $29.76). If momentum holds (e.g., breakout above $25.82), we could see extension to $31–$32 based on analyst averages (Moderate Buy consensus, target ~$31.50 from 30 analysts).
Risks to Watch: Upcoming Q2 earnings on July 30 could introduce volatility—consider trailing stops or exiting beforehand if holding through. Competition from hyperscalers (AWS, GCP) and broader tech sector dips (CFLT beta 1.71) could pressure if support fails. Not financial advice; always DYOR.
If you agree with this setup or have thoughts on CFLT, drop a comment below! Hit like if this helps, and follow for more ideas. Let's see how this plays out—I'll update as needed. 🚀
CFLT trade ideas
Moonshot Ideas $CFLT > $40- We are entering era of Agentic AI which requires real time data and agent decides to take an action on that event in near real time.
- Confluent valuation is so cheap in a massive TAM and an exploding tailwind of AI Agents. I am seeing all the tech companies and startups are building AI Agents and apetite for real time data streaming capability, processing is required.
- NASDAQ:CFLT need to ride this wave and one way they could do is by making Apache Flink to natively support Python instead of just relying on Java. If they build sdk, python library which could do the heavy lifting when it comes to stream processing, transformation then NASDAQ:CFLT would be number one choice and popular among growing Python community and ML community.
- I wouldn't be surprised to see NASDAQ:CFLT well above 60 dollars in next 2-3 years.

$CFLT will break $35 range if Q1 | FY 2025 is good- NASDAQ:CFLT has been range bound for two years now where the lower end is $14-18 and upper range is $35-38.
- If FY 2025, Q1 exceeds expectation of the analyst then this stock will be able to get through the long term resistance and turn it into support.
- NYSE:IOT is a peer company which operates in IOT and streaming data application layer which has shown promising results and returns. I believe NASDAQ:CFLT is a solid company and can reach $45+ comfortably.

CONFLUENT ($CFLT) – DATA STREAMING’S RISING STARCONFLUENT ( NASDAQ:CFLT ) – DATA STREAMING’S RISING STAR
1/7
Ready for a snapshot of Confluent? Here’s what’s sparking chatter on X: 23% YoY revenue growth, $0.09 EPS (beats by $0.03), and free cash flow at $ 29M—above estimates! Let’s dive in. 🚀💹
2/7 – REVENUE & EARNINGS BLAST
• Overall revenue: +23% YoY
• Subscription revenue: +24% YoY 💳
• Q4 EPS: $0.09 (est. $0.06) ⚡️
• FCF: $ 29M vs. est. GETTEX:27M 💰
3/7 – CONFLUENT CLOUD SHINES
• Cloud revenue: +38% YoY 🌥️
• Big piece of their puzzle—shows they’re nailing the cloud-based approach
• Key to future scaling & recurring income streams 🔑
4/7 – SECTOR SNAPSHOT
• Confluent competes in data streaming & management
• Growth suggests they’re keeping pace—maybe even undervalued if adoption keeps climbing 🤔
• Keep an eye on how they stack up vs. other cloud/data players like Snowflake or Datadog 🏭
5/7 – RISK ASSESSMENT
• Market Saturation: More competitors in cloud/data → potential pricing pressure 💼
• Tech Shifts: Rapid changes could leave older solutions behind 🔄
• Economic Downturn: Slowed IT budgets might delay or shrink deals 🌐
• Customer Concentration: If a few big clients leave, it stings big time 🏹
6/7 – SWOT HIGHLIGHTS
Strengths:
Strong Confluent Cloud growth (+38% YoY!)
Broader customer base (+17%) 🙌
Weaknesses:
Heavily niche in ‘data in motion’ 🤏
High acquisition costs in a crowded market 🏷️
Opportunities:
Expand into new verticals & geographies
AI/ML integration for next-level analytics 🤖
Threats:
Fierce giants with deep pockets 🦖
Regulatory changes in data privacy ⚖️
7/7 – Where do you see Confluent heading next?
1️⃣ Bullish—Cloud growth = unstoppable! 🌟
2️⃣ Neutral—Need more consistent profitability 🤔
3️⃣ Bearish—Competition is too intense 🐻
Vote below! 🗳️👇
Bullish on data streaming but CFLT to $15 for better risk/reward- While I believe NASDAQ:CFLT chart looks good and it might go to $40 after earnings in Q1 2025. But data platform infra is getting very competitive.
- First layer of competition comes from Hyperscalers like AWS, GCP and Azure which have their own variant of stream processing. Confluent had some leverage in terms of managed offering.
- I believed that company is unique, in a strong niche but stock based compensation and dilution has always been a problem.
- With volume of data, consumption based model makes sense. I liked that billing strategy over flat subscription type model as the prior one is easier to pass cost to consumers + have some margin (fixed).
Why I'm bearish on this name lately?
- I believe redpanda acquisition by Snowflake NYSE:SNOW would impede growth for NASDAQ:CFLT massively.
- Snowflake has a moat in data warehousing, they are trying to become all things data infrastructure.
- Streaming ingestion into snowflake is a capability which could have great synergy. While I wanted to see NASDAQ:CFLT acquisition by NYSE:SNOW but it is not possible as of now in my opinion as confluent market cap is 10 billion+ which could hamper NYSE:SNOW cash flows.
- Therefore, redpanda would be a better acquisition for NYSE:SNOW but it will severly impact NASDAQ:CFLT technical addressable market.
I would buy NASDAQ:CFLT under $20 because their future business is going to be impacted materialistically.

CFLT"Cup and Handle" Pattern:
The price movement forms a "cup" shape (yellow curve), which is a well-known bullish continuation pattern. This indicates a gradual recovery back to previous resistance levels.
The "handle" (on the right side) is a small consolidation phase, which could lead to a breakout above the resistance.
Horizontal Resistance (Blue Line):
A significant resistance zone is identified around $30, which has just been broken. This breakout is a strong bullish signal.
Potential Price Target:
The green projection line shows a target around $42, calculated based on the depth of the cup. The distance from the base (around $18) to the resistance is added to the breakout point.
Support Levels:
If the breakout fails, key support levels lie around $18-$20 (yellow dashed line), which could act as a safety zone for buyers.
Bullish Momentum:

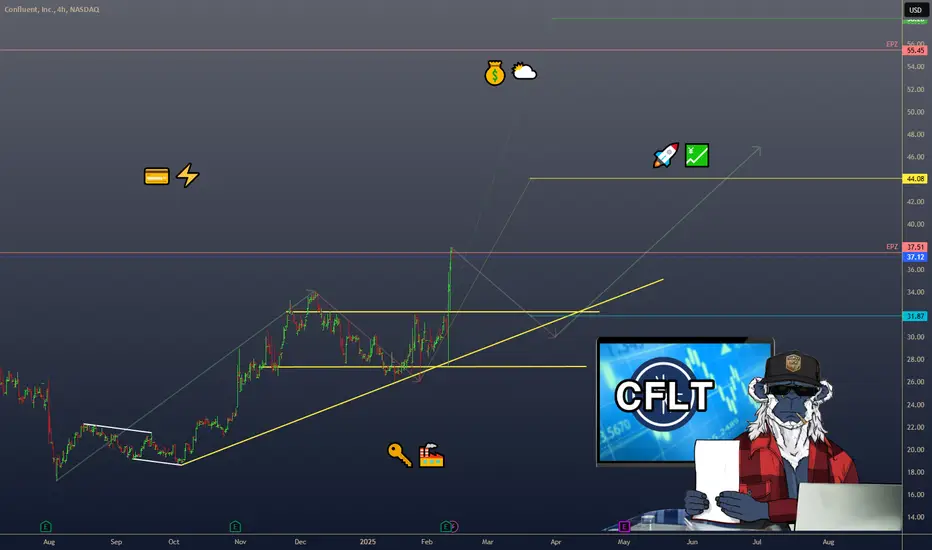
Exciting Opportunity in CONFLUENTHello fellow Traders,
I came across an interesting stock that I believe has strong potential for a rally soon. Upon analyzing its chart patterns and considering the upcoming earnings reports, it seems poised for a significant move.
Key Observations:
Current Support Level:
On the daily chart, the stock is currently sitting at a key support level, suggesting a potential reversal or upward movement. This is a critical area where buyers often step in, providing a solid foundation for a potential rally.
Dow Theory Analysis:
According to Dow Theory, which emphasizes identifying primary trends and market phases, this stock is showing signs of recovery. We might be witnessing the beginning of an accumulation phase, where smart money is entering the market in anticipation of a bullish run.
Upcoming Earnings Report:
With the upcoming earnings report on the horizon, there is potential for a positive surprise that could act as a catalyst for the stock. A better-than-expected earnings report might trigger increased buying interest and push the stock higher.
Potential Targets:
Short-term: If the stock holds its current support, we could see an initial move towards around $35.
Medium-term: Should earnings exceed expectations, the stock might rally to $52-56, capturing the attention of more investors.

CFLT LongAs you can see below we have raided structure on SSL/BSL and we came back to a discount... Y'all know what that means right? Bullish and I have my targets posted with this. Pretty simple trade here for a minimum 28% return on this with other TP's posted.

JPMorgan Upgrades Riot Platforms Stock Rating. Idea 21/03/2024Investment analysts at JPMorgan have upgraded Riot Platforms Inc.'s stock rating from "Neutral" to "Overweight" and set a target price of 15.00 USD. This adjustment is based on the anticipated significant growth in Riot Platforms' hash rate, a key performance indicator in the cryptocurrency mining industry.
Riot currently operates with a hash rate of 12.4 EH/s at its 700 MW facility in Rockdale. The company aims to activate nearly 20 EH/s at a new 1 GW facility in Corsicana within 2024. This expansion is expected to enhance the efficiency and profitability of the company's mining operations.
Therefore, let's delve into the technical analysis of Riot Platforms Inc.'s stocks.
On the D1 timeframe, a support level was established at 10.60 USD, with resistance at 12.20 USD. There is a noticeable deceleration of the downward trend and the formation of a relatively narrow channel between the resistance and support levels, with a confident rebound from the mid-January 2024 support levels.
In the H1 timeframe, long positions may be interesting upon breaking through the 12.20 USD level, with a 13.71 USD short-term target. From a medium-term perspective, holding a long position of up to 15.02 USD could be considered.
—
Ideas and other content presented on this page should not be considered as guidance for trading or an investment advice. RoboMarkets bears no responsibility for trading results based on trading opinions described in these analytical reviews.
The material presented and the information contained herein is for information purposes only and in no way should be considered as the provision of investment advice for the purposes of Investment Firms Law L. 87(I)/2017 of the Republic of Cyprus or any other form of personal advice or recommendation, which relates to certain types of transactions with certain types of financial instruments.
Risk Warning: CFDs are complex instruments and come with a high risk of losing money rapidly due to leverage. 66.02% of retail investor accounts lose money when trading CFDs with this provider. You should consider whether you understand how CFDs work and whether you can afford to take the high risk of losing your money.

Confluent Enters the Stream Processing Market - Idea 20/03/24Software development company Confluent Inc. has introduced a new solution for stream data processing. This is a promising direction for real-time information processing, and Confluent aims to capture a significant share of this future key IT segment.
Confluent has unveiled a new product called Tableflow, which integrates data analysis and streaming operations. This tool enables the transformation of streaming data into Apache Iceberg tables, a standard data storage format for large-scale analytics. These tables can be stored later and processed in data lakes (general repositories where an organisation's working data accumulates) and various analytical systems. Confluent promises virtually fail-safe operation of Tableflow.
Let's analyse the stock chart of Confluent Inc. (CFLT) for potential trading opportunities.
On the D1 timeframe, a support level was formed at 30.40, while resistance was established at 32.02. The upward trend is slightly slowing down, and a relatively narrow channel has formed between resistance and support. Volume accumulation is likely taking place for further price growth.
On the H1 timeframe, long positions might be interesting if the price breaks through the level of 32.02, with a short-term target set at 41.26. In the medium term, a long position could be held until 50.99.
—
Ideas and other content presented on this page should not be considered as guidance for trading or an investment advice. RoboMarkets bears no responsibility for trading results based on trading opinions described in these analytical reviews.
The material presented and the information contained herein is for information purposes only and in no way should be considered as the provision of investment advice for the purposes of Investment Firms Law L. 87(I)/2017 of the Republic of Cyprus or any other form of personal advice or recommendation, which relates to certain types of transactions with certain types of financial instruments.
Risk Warning: CFDs are complex instruments and come with a high risk of losing money rapidly due to leverage. 66.02% of retail investor accounts lose money when trading CFDs with this provider. You should consider whether you understand how CFDs work and whether you can afford to take the high risk of losing your money.

Confluent Inc. - stock trading idea for 15/02/2024Technology company Confluent Inc. announced a new solution for migrating data streaming services called "Confluent Migration Accelerator." This program allows the abandonment of the commonly used open-source Apache Kafka solution.
Apache Kafka is widely utilised by over 100,000 organisations worldwide, including most Fortune 500 companies. If successful, Confluent has significant prospects for increasing revenue.
Therefore, we have chosen to examine the Confluent Inc. (NASDAQ: CFLT) stock chart.
On the D1 timeframe, support has formed at 22.77, with resistance at 32.88. A relatively wide channel has developed between these levels within the uptrend. There is a high probability that the resistance will be broken.
On the H1 timeframe, a breakthrough of the 32.88 level could set a short-term target for a price increase at 41.26, while in the medium term, it could hover around 50.99.
—
Ideas and other content presented on this page should not be considered as guidance for trading or an investment advice. RoboMarkets bears no responsibility for trading results based on trading opinions described in these analytical reviews.
The material presented and the information contained herein is for information purposes only and in no way should be considered as the provision of investment advice for the purposes of Investment Firms Law L. 87(I)/2017 of the Republic of Cyprus or any other form of personal advice or recommendation, which relates to certain types of transactions with certain types of financial instruments.
Risk Warning: CFDs are complex instruments and come with a high risk of losing money rapidly due to leverage. 66.02% of retail investor accounts lose money when trading CFDs with this provider. You should consider whether you understand how CFDs work and whether you can afford to take the high risk of losing your money.

Confluent (NASDAQ: CFLT) Surges 35% on Stellar Quarterly ReportShares of Confluent (NASDAQ: NASDAQ:CFLT ) skyrocketed on Thursday, igniting a fervor among investors as the company's quarterly financial report surpassed even the loftiest expectations. With a remarkable surge of 35.4%, the stock exemplified the resilience and potential of Confluent in the data streaming and cloud market.
Unveiling a Financial Triumph:
Confluent's (NASDAQ: NASDAQ:CFLT ) fourth-quarter performance shattered forecasts, with revenue surging to $213 million, marking a remarkable 26% year-over-year increase. Fueling this impressive growth was a 31% climb in subscription revenue, propelling adjusted earnings per share (EPS) to an impressive $0.09. Analysts, taken aback by the company's stellar performance, had anticipated revenue of $205.3 million and an adjusted EPS of $0.05, making Confluent's triumph all the more exhilarating.
Confluent Cloud Soars to New Heights:
Amidst its financial triumph, Confluent (NASDAQ: NASDAQ:CFLT ) achieved a significant milestone with its first-ever quarter of $100 million in Confluent Cloud revenue, signaling a remarkable 46% year-over-year increase. Moreover, the company boasted a dollar-based net retention rate of 125%, a testament to its ability to retain and expand its existing customer base. This strategic focus on cloud services aligns with Confluent's vision of becoming a consumption-oriented business, poised to capitalize on the burgeoning $60 billion data streaming platform market.
Navigating the Path Forward:
While the third quarter had left investors apprehensive about Confluent's (NASDAQ: NASDAQ:CFLT ) transition strategy, the fourth-quarter results served as a resounding affirmation of its trajectory. CEO Jay Kreps emphasized the company's commitment to driving innovation in the data-in-motion market, highlighting Confluent's pivotal role in removing barriers and propelling technological advancements forward. With a clear roadmap ahead, Confluent is poised to capitalize on the immense opportunities within the rapidly evolving data landscape.
A Bullish Outlook:
Looking ahead, Confluent's (NASDAQ: NASDAQ:CFLT ) guidance for the first quarter and full year further solidifies its position as a frontrunner in the industry. With management forecasting revenue of $211.5 million for the first quarter and a full-year projection of $950 million, Confluent is poised to surpass Wall Street's expectations and cement its status as a market leader. As CEO Jay Kreps aptly stated, the data-in-motion market remains ripe for disruption, and Confluent stands at the forefront of this transformative journey.
Conclusion:
In conclusion, Confluent's (NASDAQ: NASDAQ:CFLT ) remarkable surge following its quarterly report underscores the company's unwavering commitment to innovation and excellence. With stellar financial results, groundbreaking achievements in Confluent Cloud, and a bullish outlook for the future, Confluent is primed for continued success in the dynamic world of data streaming and cloud technology. As investors celebrate this momentous occasion, the stage is set for Confluent to carve out a formidable presence in the data landscape, driving value for customers and shareholders alike.

CFLT short12/20/23
CLFT short
weekly chart is bouncing off of the lower band of a channel pattern, however my short trade is going to be for a few hours/days.. my target is the 100SMA in the 78min chart

CFLT short12/20/23
CLFT short
Weekly chart is bouncing oof of the lower band of a channel pattern, however my short trade is going to be for a few hours on the 78min. chart/ my target is the 100SMA

$CFLT Long Watchlist – Looking to Break-out of Channel?Looks like NASDAQ:CFLT has retraced its latest uptrend back to around the .618 Fib level. It is now hanging just under the 50% retrace level. I am not a big Fibonacci trader, but I do like to look at retracements and the .618% and 50% levels seem to be levels where stocks “can” make a turn.
I use trendlines and support / resistance areas for my trading style. In this case, the 50% retrace area lines up well with an area of resistance. I like how it seems to be respecting (somewhat) the 40 Week MA in white. I have an alert set for a cross over $31 and again over the upper downtrend line. To be clear, NASDAQ:CFLT is in a confirmed downtrend based on the downward sloping channel and a series of lower highs and lower lows. So, I am looking for a trend change. All TBD.
Earnings are about 9 days away and is something to keep an eye on too. (I have not verified the Earnings date.)
Ideas, not investing / trading advice. Comments always welcome. Thanks for looking.

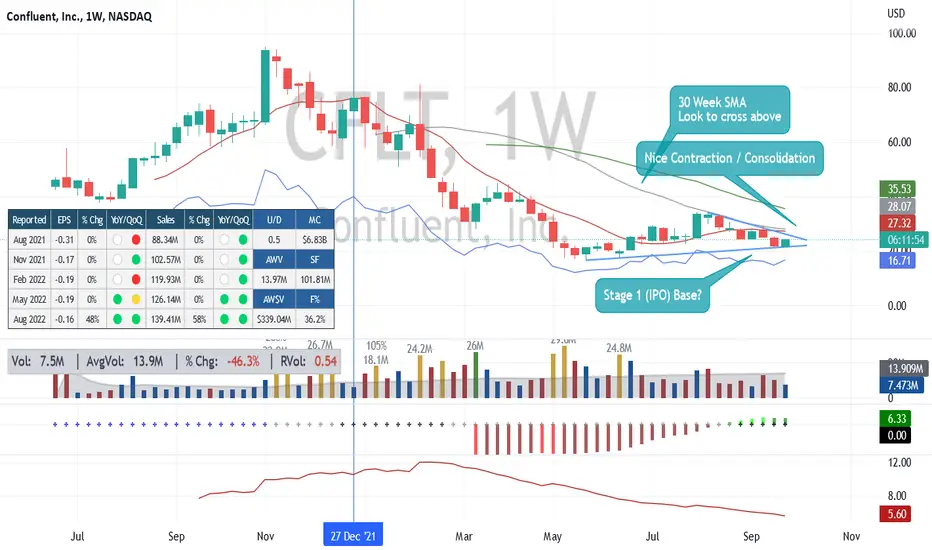
11 Month Base In $CFLT ConfluentConfluent NASDAQ:CFLT has an 11-month base formation since last May 2022 almost every month has touched the price of $22.6/sh.
This May the price of NASDAQ:CFLT has "range expanded up" which can mean that buyers are in control and stepping up after they have accumulated enough shares to control the price.
The base measures 100% from a low near $17 to a high near $34, so the upside target is 100% up from close to the $22.6 level which is the bottom of the mode for a target of $45-$47.
The stop is a drop back under the mode at $22 or 3 ATR's (average true ranges) from the current price.
Tim West
May 26, 2023
12:31PM EST
$29.05 last

CFLT Confluent Options Ahead of EarningsAnalyzing the options chain and the chart patterns of CFLT Confluent prior to the earnings report this week,
I would consider purchasing the 45usd strike price Calls with
an expiration date of 2024-4-19,
for a premium of approximately $4.35.
If these options prove to be profitable prior to the earnings release, I would sell at least half of them.
Looking forward to read your opinion about it.

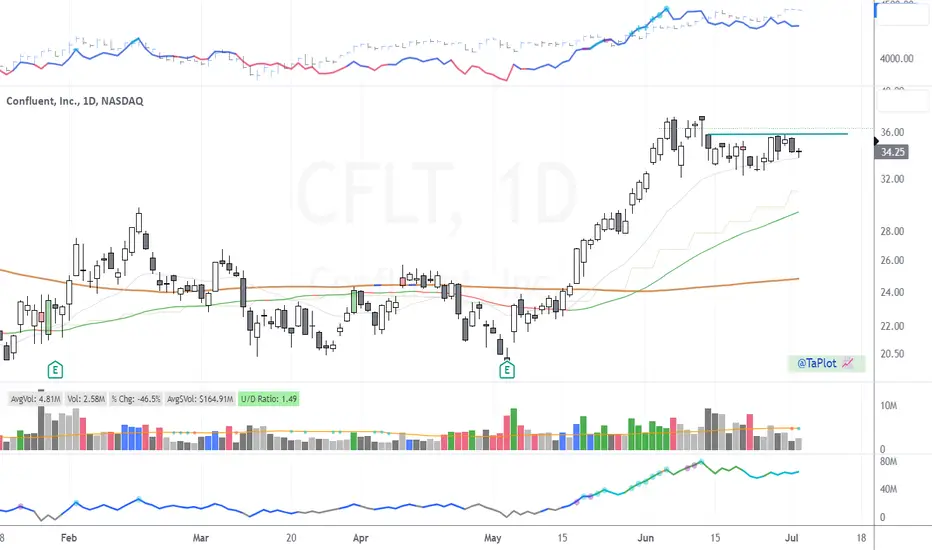
$CFLT Setting UpNASDAQ:CFLT lots to like here.
* Week 4 into its consolidation after a powerful stage 1 breakout.
* 200 MA not uptrending yet but flat
* Almost 100% move up & powerplay setup
* OBV holding highs with 1.5 U/D ratio
* double digits sales growth Q after Q
CFLT - New trend emergingCFLT broke above a basing neckline on 2nd June and has now pulled back to retest this neckline for since the last few days. So far, this neckline is still proving to be a support and it could be a good time to stake into the new uptrend that is emerging (with initial stop loss below the neckline at $31.50).
Other technical factors that have lined up to increase its odds of success are:
1. Basing for the last 12 months (the long the basing period, the more sustainable the new trend)
2. now trading above it's 200 day moving average with a golden cross on 31st May
3. good increase in volume (ie., accumulation) seen in the weeks leading to the breakup on 2nd June
The next area of strong resistence (aka supply) could be around $43 - $45 (which is 22-25% upside from here). There is a reasonable chance that it could go beyond this level in the coming months, however, I will manage trade with trailing stop loss along the way up. Sometimes it is ok to be stopped out prematurely (high chance in a volatile market) but we can always re-establish a position once the consolidation is over and momentum returns.
Disclaimer: Just my 2 cents and not a trade advice. Kindly do your own due diligence and trade according to your own risk tolerance and don't forget that money management is important! Take care and Good Luck!

How to use Time at Mode on $CFLTI have put an example of the "Time At Mode" technique that is very useful and gives specific time and price targets for stocks, indexes and commodities.
Begin the analysis in the lower-left-corner at the lowest low.
Once the market has had 5 weeks without making a new low, we can conclude that a weekly uptrend has started from the lowest low.
Over time the "mode" forms where in this case there are 12 weeks at the same price. A horizontal line touches 12 different weeks (not including the first bar that declines into the low, so don't count that first bar to be conservative.
The way a trend "kicks off" after a mode has formed is to see a "range expansion" which is a rally greater than the previous weeks' range which you see in mid-May with the advance over $25 above the "bright green rectangle" from 23-25. The "range expansion" implies that the demand is strong enough to sustain a lift-off and the trend continues.
The time of the trend is the # of bars that touch the mode. The price projection of the trend is the "Range Around the Mode" which is then "added to the mode" to get the upper target.
There is a conservative mode which is the "lowest low of the mode" in an uptrend. The aggressive mode is the "highest high of the mode".
Project the range around the mode and the time of the mode, in this case 12 weeks, up from the mode.
The risk? A move back under the low of the week.
Additional entries for longs happen at 50%-75% retracements of the "Range Expansion Bar" that kicked off the trend from the mode.
Other techniques allow us to use our emotions to both double-up our position if we feel "scared" as the profits add up and we can also "exit" longs if we get "excited" about our profits. These additional techniques take some time to learn, but allow us to use our emotions as powerful indicators that are extremely reliable once you learn yourself.
I hope you all enjoyed this little example of "Time At Mode" and come to Key Hidden Levels chat room right here at TradingView to see us apply this method on a daily basis.
Cheers,
Tim West. 11:00AM EST
June 2, 2023 33.96 last NASDAQ:CFLT

CFLT Uptrend Rectangle pattern with BreakoutNASDAQ:CFLT Confluent, Inc. operates a data streaming platform in the United States and internationally.
Uptrend rectangle pattern, above AVWAP from Highest point and ipo day. Breakout (pivot point) ~34 with Massive 6 weeks accumaltion.
Breakout (pivot point): ~34
Target ~ 63


$CFLT Flat IPO Base? Watchlist Name.$CFLT Here’s one for your watchlist. It looks to me that this has been consolidating in a stage 1 base for 20 weeks and has just moved sideways in a down market. To me this is showing some relative strength. This is not ready yet but if / when it moves above the down trendline, I will likely start a small position and add once it moves with volume above the 30 week MA. See chart for notes.
Ideas, not investing / trading advice. CFLT has an impressive client list including TSLA, LOWES, CITI and many more.