Massive Short Squeeze in CanopyCanopy is on fire today, and is up 20% plus on the week, off the back of optimism over the possible decriminalization of Marijuana in the United States. Last night at the Vice Presidential Debate, Kamala Harris made mention of the dems plan to bring this to fruition, should they win the election in November. This has the entire sector hot today, without exception, as one can expect.
It looks as though we may hit the 200 day MA at 23.30 this week before we see profit taking, and the shorts re-entering. It's also important to note that we're nearing major resistance with the top of the downward channel a stones throw away. I suspect we may see a reversal of the squeeze next week once the bulls have achieved these levels. If there's enough momentum to pierce the upper downtrend line, and the 200 day MA, the upside could be massive, particularly seeing as earnings are not until early November.
We shouldn't rule out the possibility of a broad market sell off, given the high number of potential catalysts floating around at the moment. This could heavily affect Canopy's price action, and the positive sentiment around it's valuation.
I appreciate your time today guys. Thanks, Michael.
If you like our analysis, please hit the Like button and subscribe to our profile so you don't miss our new analysis and updates.
The information and analysis shared in this post is not financial advice. Always conduct your own analysis and research.
CGC trade ideas

Canopy Looking Particularly WeakCanopy is in a defined downtrend, and has been trading below it's 21 day EMA since mid August with diminishing volume. Note: earnings release is early November, and the stock has consistently sold off heavily on recent earnings reports off the back of low demand, high supply, and the natural constraints of scaling the edibles/drinks business, among other constraints.
The industry has taken a beating with favorites like Aphria down 90% plus from past highs. Aphria's recent earnings report was a monster disappointment, and sent the stock tumbling 20% plus in a single day. I've seen moves of similar magnitude to the downside in Canopy off the back of recent, and similarly disappointing earnings reports. I suspect just as we've witnessed before, the stock will be pumped into earnings, only to be hammered lower once again.
Stay tuned.
Michael
If you like our analysis, please hit the Like button and subscribe to our profile so you don't miss our new analysis and updates.
The information and analysis shared in this post is not financial advice. Always conduct your own analysis and research.

Is Canopy trading in a bullish flag?It's very likely this plays out bearishly as a descending triangle, Canopy recently released earnings & the price continued to sell off immediately in the days following, despite the financials improving from previous quarters, and despite strong beverage sales the market seems to favor the U.S focused MSO's at the moment.
Canopy will need some compelling news to break this pattern to the upside.
Canopy is displaying a Symmetrical Triangle pattern as well, notice the green upward sloping line of support, Symmetrical triangles differ from ascending triangles and descending triangles in that the upper and lower trendlines are both sloping towards a center point. In contrast, ascending triangles have a horizontal upper trendline, predicting a potential breakout higher, and descending triangles have a horizontal lower trendline, predicting a potential breakdown lower. Symmetrical triangles are also similar to pennants and flags in some ways, but pennants have upward sloping trendlines rather than converging trendlines.

Pot stocks reviewlet me know your thoughts,, big long term sector most probably but not yet ready to jump in,,
what you guys think, Rick


Possibly a Head & Shoulders Breakdown for WEED.Canopy appears to have broken the base line of support of a micro Head & Shoulders, the blue line is where I have the base of support for the pattern.
The RSI is starting to creep into an area where WEED has seen support, the green arrows pointing to the right is what I am referring too.

Fake out on the Ascending Triangle to the downside?It appears as though Canopy may have pulled a fake out to the downside on an ascending triangle I have outlined in dark blue.
In my previous post I mentioned how the RSI has seen bullish support when approaching the green arrows pointing side ways to the right, where I had a question mark in my previous post is now a green arrow coinciding with the others.
Possibly a bullish flag outlined in green, the downward sloping resistance keeps getting breached to the upside negating a descending triangle / bear flag.


The bear market continuesThe cannabis bear market is not over. Looking for a normal continuation with one last capitulation bringing the price back to the 10$ region. This is still well within the realms of possibility given the scope of this bubble. The strong companies that will survive will most likely see a recovery and return to normal going into early-mid 2021 and will continue to thrive into the decade once this recession is over.
Looking at January 2021 10$ puts @4.60$


WEED. Ready to fill $25 gap. Hello Traders,
Weed is forming classic bull-flag setup ready to fill in $25 gap.
Hourly 100MA is around $24.80, which may act as resistance.
Weed is fundamentally very strong company with quick ratio over 5 and this stock will be a good long term hold.

$WEED Canopy Growth earnings call expectations...Canopy Growth will announce earnings on Friday this week. The market has priced in a good earnings call....but has it priced in a GREAT one......?
We shall see..........


Is WEED trading in a Bullish Flag?Potentially a Ascending Triangle as well, but we haven't seen a retest of the blue upward sloping support, instead Canopy has created a series of higher lows forming an inverted head & shoulders, next week will confirm the trend.
An inverse head and shoulders, also called a "head and shoulders bottom", is similar to the standard head and shoulders pattern, but inverted: with the head and shoulders top used to predict reversals in downtrends. This pattern is identified when the price action of a security meets the following characteristics: the price falls to a trough and then rises; the price falls below the former trough and then rises again; finally, the price falls again but not as far as the second trough. Once the final trough is made, the price heads upward, toward the resistance found near the top of the previous troughs.
An inverse head and shoulders is similar to the standard head and shoulders pattern, but inverted: with the head and shoulders top used to predict reversals in downtrends
An inverse head and shoulders pattern, upon completion, signals a bull market
Investors typically enter into a long position when the price rises above the resistance of the neckline.
Bullish flag formations are found in stocks with strong uptrends. They are called bull flags because the pattern resembles a flag on a pole. The pole is the result of a vertical rise in a stock and the flag results from a period of consolidation. The flag can be a horizontal rectangle, but is also often angled down away from the prevailing trend. Another variant is called a bullish pennant, in which the consolidation takes the form of a symmetrical triangle. The shape of the flag is not as important as the underlying psychology behind the pattern. Basically, despite a strong vertical rally, the stock refuses to drop appreciably, as bulls snap up any shares they can get. The breakout from a flag often results in a powerful move higher, measuring the length of the prior flag pole. It is important to note that these patterns work the same in reverse and are known as bear flags and pennants.
An ascending triangle is a chart pattern used in technical analysis. It is created by price moves that allow for a horizontal line to be drawn along the swing highs, and a rising trendline to be drawn along the swing lows. The two lines form a triangle. Traders often watch for breakouts from triangle patterns. The breakout can occur to the upside or downside. Ascending triangles are often called continuation patterns since the price will typically breakout in the same direction as the trend that was in place just prior to the triangle forming.
The trendlines of a triangle need to run along at least two swing highs and two swing lows.
Ascending triangles are considered a continuation pattern, as the price will typically breakout of the triangle in the price direction prevailing before the triangle. Although, this won't always occur. A breakout in any direction is noteworthy.
Time will tell I suppose.

Canopy Growth (Weed) .... Perking to go higher ?
A Cup and Handle pattern is forming.
Still range bound but a solid break of the dopped line should produce a couple of dollars profit.
S.

STONKS - WEED - Looks bullish, but it might switch up :| likeWTFGLHF, stay inside and trade at your own risk!


The Difference Between A Death Cross And A Golden Cross?What Does The Death Cross Tell You?
The death cross occurs when a short-term moving average (typically 50-day SMA) crosses over a major long-term moving average (typically 200-day SMA) to the downside and is interpreted by analysts and traders as signaling a definitive bear turn in a market.
The opposite of the death cross occurs with the appearance of the golden cross, when the short-term moving average of a stock or index moves above the long-term moving average. Many investors view this pattern as a bullish indicator. The golden cross pattern typically shows up after a prolonged downtrend has run out of momentum. As is true with the death cross, investors should confirm the trend reversal after several days or weeks of price movement in the new direction. Much of the process of investing by following patterns is self-fulfilling behavior, as trading volumes increase with the attention of more investors who are driven in part by an increase in financial news stories abut a particular stock or the movement of an index.
Limitations Of Using The Death Cross
All indicators are “lagging,” and no indicator can truly predict the future. Once & while a death cross can produce a false signal, and a trader placing a short at that time would be in some near-term trouble. Despite its apparent predictive power in forecasting prior large bear markets, death crosses also do regularly produce false signals. Therefore, a death cross should always be confirmed with other signals and indicators before putting on a trade.
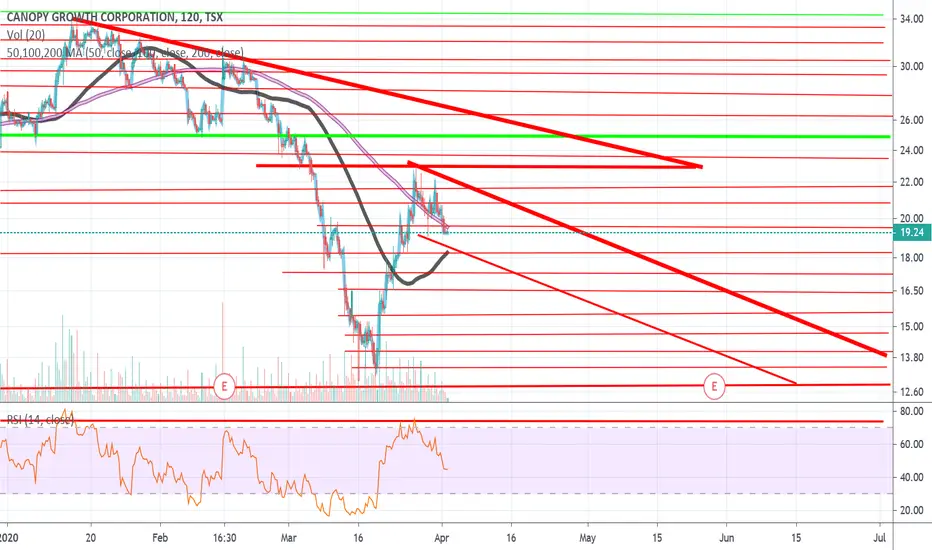
Is Canopy trading in a bull flag? Or possibly a descending triangle, but the 200 day MA has held since roughly March 18th 2020, building a nice stair-case like pattern.


Canopy Growth ($WEED) is a price floor finally forming?Canopy Growth, widely-considered one of the most successful public companies in the cannabis sector, has shown a pretty volatile history as traders try to set prices and speculators skew supply and demand in this nascent industry. One thing is certain, many of the traded cannabis companies will fail commercial, some are simply shell companies holding portfolios full of other shell companies in cannabis, bioceuticals, vaping and cosmetic etc. Canopy Growth, however, is definitely considered to be a company to watch and which all cannabis stock investors should hold.
Obviously, this area underwent a hype cycle where prices became hugely inflated far beyond the capacity of these companies to deliver profits at the time, but what does the future hold? The fundamentals here are good with increasing cannabis use across all demographics, however they will largely be determined by legislation. It's a case of wait and see, but cannabis bulls are optimistic here. From a technical perspective, we need to ask whether these previously high growth stocks could be in a secular bull market, that is a market displaying continuous net growth characterized by short-term and alternating bull and bear phases. If this is the case, we should expect to find the bottom for Canopy Growth around here. Technically we should see long-term support structure develop here, which tests the price floor a number of times indicative of accumulation.
For cannabis bulls none of this matters, they will be buying here anyway.
---------------------------------------------------------------------------------------------------------------------------------------------------------
weedmoon -- Pumping Weed Stocks to the Moon
All information is provided informally, without any acceptance of liability or guaranty on the part of the author "weedmoon".
All trades made by the reader are the sole responsibility of the reader.
420 Ho!
