CINF: might we see a counter rally?A price action above 113.00 supports a bullish trend direction.
Increase long exposure for a break above 115.00 (just below its 23.6% Fibonacci retracement level).
The stop-loss is set at 111.00 (at its 50% retracement level).
The price action bounced from some almost oversold territory.
Remains above its 200-day simple moving average.
Remains a risky trade as the bounce can be truncated.
CINF trade ideas

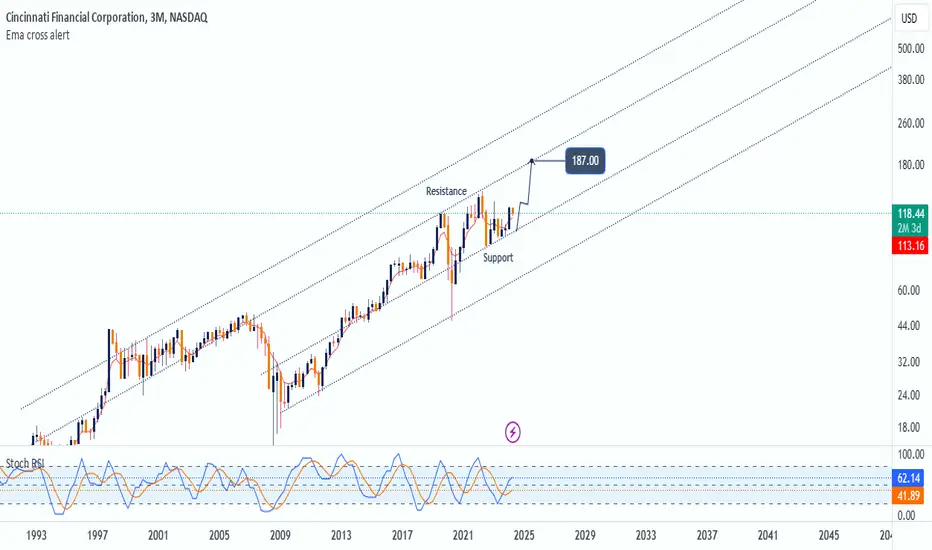
Cincinnati Financial (CINF) Climbs After Resistance Break Cincinnati Financial (CINF) recently broke resistance at $115, predicting a specific future price target like $187 is not difficult.
CINF just reported Q1 2024 earnings. They beat EPS estimates but missed revenue estimates
$CINF and $AFG long investmentUPDATE: The image I embedded in the TV chart for this idea was somehow rejected on the post. So I posted it on Imgur instead.
+++++++++++++++++++++++++++++++++++++++++++++
The chart I present for this idea doesn't look like a normal TradingView chart. The reason is that this is not a trade, based on chart technicals, but an investment, which I intend to hold for years. So, I don't care quite so much whether the stock wiggles upward or downward or sideways over the next two weeks. If you're looking for a trade, stop reading now. This idea is not for you.
If you're still reading, you're waiting for an explanation of the above chart. I I'll get to that, but first I want to step back a bit further.
I spent the last week looking through US-listed insurance companies for a candidate to invest for the long haul.
Why?
First: Real yields are at 2.5%, a level not seen since the GFC. This favors owning low-risk bond portfolios -- the kind insurance companies have. Both NYSE:AFG and NASDAQ:CINF have about $1.50 in investments for every dollar in market cap.
Second: As rates plateau, the AOCI losses that depress the tangible equity of insurance companies can gradually reverse, becoming a value creation tailwind. AOCI is 6% of NASDAQ:CINF 's tangible BV, and 14% of NYSE:AFG 's. This is very modest. Other insurance companies ($LNC...) ignored duration risk and had their portfolio bludgeoned half to death. From a short-term point of view, that makes NYSE:LNC perversely intriguing. If that stock survives its could get quite the bounce. But owning insurance stock shouldn't be a thrilling experience.
Third: Insurers are raking in big rate increases as they reprice catastrophe risks, inflation, and "social inflation". Florida homeowners know what I'm talking about.
And lastly: NASDAQ:CINF has a beta of 0.65, NYSE:AFG has a beta of 0.8. In other words these are "defensive" stocks, unlike banks, say. In uncertain times, insurers may suffer less than other industries. Though, the record is a bit uneven on that: During the dotcom crash they did well, in the GFC and pandemic, not so much.
So, to finally get to the chart: What even is the Tangible Value Creation Ratio? It's a modification of a key metric that NASDAQ:CINF uses to manage their business. Here's their definition :
“Value Creation Ratio” means the total of 1) rate of growth in book value per share plus 2) the ratio of dividends declared per share to beginning book value per share.
I prefer tangible book value to book value, so that's what I use. But that quibble aside, I really like this metric: It captures what I am truly interested in as an investor: Dividends and growth in the value of common shareholder's tangible equity. And the ratio also doesn't penalize companies for their choices with respect to dividend policy, capital structure, stock splits, and so on. It simply holds management responsible for the outcome to common shareholders. So, I calculate that ratio on a quarterly basis, aggregate it over multi-period spans and then annualize it. I think this ratio is particularly suited for a long-term analysis, since there's a certain variability in the short term, due to catastrophe losses and/or rate fluctiations. I actually did create the chart for a full 20-year span. If anyone wants to see it, let me know. But NASDAQ:CINF 's executive team came on in 2011, and it seems that the performance of the company has improved substantially since then.
Obviously, Berkshire Hathaway is the biggest insurer in the group. And based on this chart it looks very fairly priced for its excellent long-term performance. So why don't I want it? It's not that I don't trust Buffett & Munger, or their eventual replacements. I am more concerned about investors' reaction to these legends passing the baton. Whenever and however that might happen. To me, this just seems like a big event risk. As for NYSE:PGR , I'd love to own it, if it ever comes back from the valuation stratosphere. NYSE:RLI also seems like a very well-run insurer. But the slight edge in long-term performance doesn't seem to justify the huge bump in valuation.
A word about my data: I calculated these metrics programmatically, using financial statements downloaded from public sources. I did verify some of the data and calculations, but the testing is limited at this point. If anyone wants to compare notes, I am happy to.
As a last note: NASDAQ:CINF will report earnings after the close today. (Thursday, 2023-10-26). I bought some yesterday. But I doubt that the stock will jump in a meaningful way after earnings, even if they turn out to be brilliant. This thesis will likely take several years to play out one way or the other.

$CINF with a bullish outlook following its earnings #StocksThe PEAD projected a bullish outlook for $CINF after a positive under reaction following its earnings release placing the stock in drift A with an expected accuracy of 61.54%.
CINF - Double BottomCINF has formed a nice double bottom
I expect the recovery of the second bottom to be similar to the first bottom, hence I have drawn the ascending diagonal lines against the two bottoms upwards
Bullish reversal situation

$CINF with a Bullish outlook following its earnings #Stocks The PEAD projected a Bullish outlook for $CINF after a Positive Under reaction following its earnings release placing the stock in drift A with an expected accuracy of 100%.
$CINF with a Neutral outlook following its earnings #Stocks The PEAD projected a Neutral outlook for $CINF after a Negative Under reaction following its earnings release placing the stock in drift D with an expected accuracy of 100%.

CINF: A Good Pullback Trading Opportunity-INTRODUCTION-
Cincinnati Financial Corporation has been moving in an ascending channel since 2020 summer after its recovery from the pandemic economic shock. Last month, the price has reached a new high at the $142.50 level. After reaching a new high, the price retraced and retested the suport level of $120. From the support level, the price has formed a potential double top pattern, making a neckline area at around the $126 level.
-TRADING PLAN-
The price has reached a new high; therefore, we will plan to buy the pullback. Currently, we are watching for a breakout from the neckline of the double bottom pattern. After a clear breakout, we will place our buy limit orders at the neckline level to capture the retest. Our buy target is set at the previous high of $142.50 level.
Check out our previous trend-following stock trading ideas below :)


$CINF (Cincinnati Financial Corp) - Long to $160 Here is the analysis behind my latest stock purchase $CINF (Cincinnati Financial Corp)
PE Ratio (Trailing) = 5.42
ROE = +29.9%
ROA = +11.4%
ROIC = +10.9%
Solid data there and then the cash situation looks very strong. cash flow is growing but capital expenditures are not meaning the free cash flow is growing in recent years with the most recent 12 months bringing in 1.65 billion
We have 947 million in total cash and 905 million in total debt so this is a well balanced company from that aspect. Considering the debts are well managed and the growing cash flow inline with the average growth of just over 7% for the last 10 years, this to me looks like a strong company that is currently undervalued.
I believe the intrinsic value of this stock to be at $160 based on the current fundamental data

CINF Late COVID Play?My Opinion:
Appears to be recovering late from March 2020 COVID dip...
Setup appears bullish and earnings are up!
I would hope to see a return to $115!
Thoughts?

is the 6 months consolidation over?Printing higher lows and higher hows is the first sign of an uptrend, the conversion line has been dancing with the base line for a long time, but now it looks like conversion line has a lift off. We can place a stop loss just below the cloud which luckily not too far from the price now where we can enter guarantees us a nice risk reward ratio.

CINF Gap FillBringing this gap fill to attention. It completed a very obvious move downwards, and is likely to start moving back upwards. These types of moves are usually reliable.

Inverse H&S Ascending Triangle Bottom FishingEarnings 10-26 AMC
Dividend is good
This stock has taken a beating
Sometimes looking at the bottom at stocks that have been out of favor can pay off
Do your research
NV is very high on this one
If price breaks the A triangle, the upper trendline becomes support. As of now it is R
Price must cross neckline in a clear uptrend
There are several A Triangles, I put the largest one on the chart. Price has not broken cleanly from any of them yet. If it hits entry level it will be well on it's way.
Very bullish chart though
Not a recommendation
Cincinnati Financial Corporation, together with its subsidiary, provides property casualty insurance products in the United States. The company operates in five segments: Commercial Lines Insurance, Personal Lines Insurance, Excess and Surplus Lines Insurance, Life Insurance, and Investments. The Commercial Lines Insurance segment offers coverage for commercial casualty, commercial property, commercial auto, and workers' compensation. It also provides director and officer liability insurance, contract and commercial surety bonds, and fidelity bonds; and machinery and equipment coverage. The Personal Lines Insurance segment offers personal auto insurance; homeowners insurance; and dwelling fire, inland marine, personal umbrella liability, and watercraft coverages to individuals. The Excess and Surplus Lines Insurance segment offers commercial casualty insurance that covers businesses for third-party liability from accidents occurring on their premises or arising out of their operations, such as injuries sustained from products; and commercial property insurance, which insures buildings, inventory, equipment, and business income from loss or damage due to various causes, such as fire, wind, hail, water, theft, and vandalism. The Life Insurance segment provides term life insurance products; universal life insurance products; worksite products, such as term life; and whole life insurance products, as well as markets deferred annuities and immediate annuities. The Investments segment invests in fixed-maturity investments, including taxable and tax-exempt bonds, and redeemable preferred stocks; and equity investments comprising common and nonredeemable preferred stocks. The company also offers commercial leasing and financing services; and insurance brokerage services. Cincinnati Financial Corporation was founded in 1950 and is headquartered in Fairfield, Ohio.

BUY to CINCINNATI FINANCIAL CORPHey traders, CINCINNATI FINANCIAL CORP is at the top of the equilibrium zone, refusal of buyers on a large volume of large purchase. Potential to breakout the zone upwards to join a new zone, to go and retest its last previous point higher, which is just on the top of the zone of equilibrium and to start again lower.
Please LIKE & FOLLOW, thank you!

CINCINNATI FINANCIAL CORPNASDAQ:CINF
Hey, traders.
The market gave us a surprise yesterday due to interesting news.
During trading , bank regulators weaken Walker's rule by allowing banks to participate in venture capital funds.
Already after trading : The Federal Reserve limits bank dividends and prohibits buyback of shares until September.
Apparently, banks have serious problems.
If the positive news remains, the SPY may retest the upper level of channel 313.1.
I summed up the statistics for June today :
22 of my ideas worked well.
Not all of the selected papers went on the same day, there are at least 3 other instruments, which I have been watching for quite a while.
Thus, the percentage of positively selected instruments: 70.9%.
I consider it to be quite a good result for me.
However, I must admit that it is especially difficult to trade on this type of market .
For some instruments, for example, there were not always entry points.
The last days were especially difficult.
I admit, with the abolition of self-isolation, it's harder and harder to spend a lot of time writing ideas. I have to do my basic work as well.
Anyway, it's a new month, so it's time for work again.
The CINCINNATI FINANCIAL CORP is on the list today.
What we see on the chart:
1. Level, formed on June 4, which was confirmed several times.
2. The fall of June 11 was bought back.
3. False breakout on June 16 did not give us a strong impulse, the paper did not roll back down.
4. We observe a set of positions by a large long player and a series of close retests.
5. I expect further compression formation under the level.
Safe scenario:
Entering the long after the breakout and level retest.
Stop Loss is placed under the level.
Aggressive scenario:
Put Buy Stop above the level and wait for the breakout.
We must look at the SPY behavior. The directions of these two tools should coincide.
Stop loss is placed behind the breakout bar.

CINF is looking to test resistance. Hello,
What is CINF?
Cincinnati Financial Corporation offers property and casualty insurance, its main business, through The Cincinnati Insurance Company, The Cincinnati Indemnity Company and The Cincinnati Casualty Company. The company has 1.01% of the domestic property and casualty insurance premiums, which ranks it as the 20th largest insurance company by market share in the U.S
Latest News
My thoughts,
The weekly chart tells me that we had hit bottom and are now looking to test resistance. Keep in mind this is an ABC correction that is bearish. If the price manages to surpass the 1.618 fib level, then We will be looking for a double top formation which is again bearish.
Good Luck, Cheers!
Be sure to comment, follow, like, and check out my profile for more trade ideas!

Cincinnati Financial Corporation (CINF) long.All description on the chart.
Please, don't forget to like and follow.
Thank you.

$CINF can fall in the next daysContextual immersion trading strategy idea.
Cincinnati Financial Corporation, together with its subsidiary, provides property-casualty insurance products in the United States.
On APR 27 the share price fell after bad earnings. Looks like it will continue falling.
The demand for shares of the company looks lower than the supply.
This and other conditions can cause a fall in the share price in the next days.
So I opened a short position from $66,04;
stop-loss — $69,53.
Information about take-profits will be later.
Do not view this idea as a recommendation for trading or investing. It is published only to introduce my own vision.
Always do your own analysis before making deals. When you use any materials, do not rely on blind trust.
You should remember that isolated deals do not give systematic profit, so trade/invest using a developed strategy.
If you like my content, you can subscribe to the news and receive my fresh ideas.
Thanks for being with me!

CINF- Ready to derail?July Puts are like $0.80 for $3 difference in strike. This thing is SO overbought. MACD is weak on all time frames that I looked at. (1D, 1H, 2H, 4H) Ascending wedge. Stoch ready for a flip at ANY time. MACD ready to go at any time. RSI exhausted. This should be fun lol Targeting $95-98 (98 from the top of the wedge would be around .382 retracement, 97ish from current top, but we also seem to have decent support, from current $95 would put us around support and .5 retracement.)
This is not advice. And yes I will be scooping Puts on this.

CINF Platform Pattern Hidden AccumulationCINF is an S&P 500 index component. The chart shows a platform sideways pattern typical of Dark Pool hidden accumulation. This was followed by a long white candle that was not HFT driven. The stock is now in another consolidation, at a new high with more hidden accumulation.

Short CINFOur Quant Algo has been flashing a short signal on CINF .
Expect the price to go down by at least 3% in next 60 days.
** This signal is the result of a quantitative analysis.

CINF wants higherGot Filled on Long Position: CINF 17MAR '17 70 C @5.30
Target: stock $78 // option at least $7
