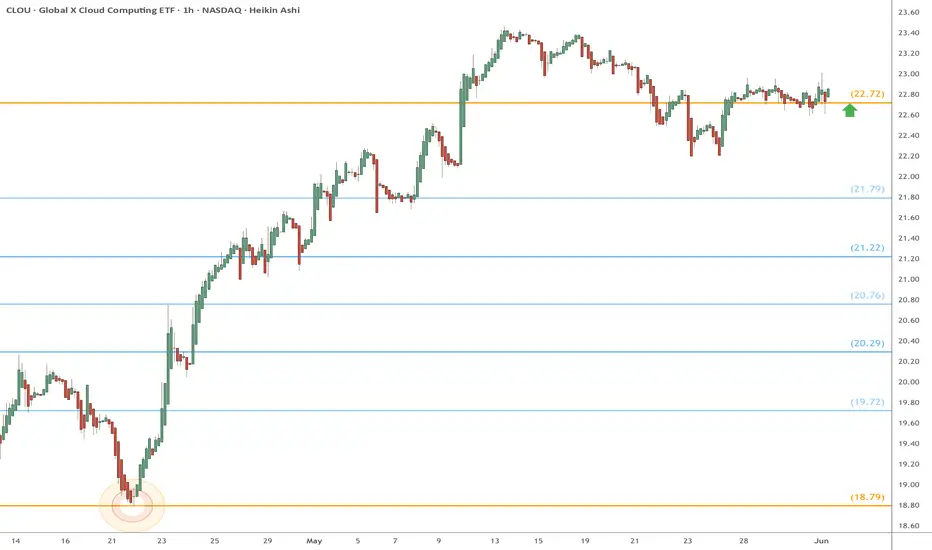
CLOU eyes on $22.72: Golden Genesis fib for high support CLOUCLOU currently orbiting a Golden Genesis fib at $22.72
Its sister golden below at $18.79 was the recent bottom.
Look for a pop from here with tight stop-loss just below.
Key stats
About Global X Cloud Computing ETF
Home page
Inception date
Apr 12, 2019
Structure
Open-Ended Fund
Replication method
Physical
Dividend treatment
Distributes
Distribution tax treatment
Qualified dividends
Income tax type
Capital Gains
Max ST capital gains rate
39.60%
Max LT capital gains rate
20.00%
Primary advisor
Global X Management Co. LLC
Distributor
SEI Investments Distribution Co.
CLOU offers equity exposure to cloud computing firms. It holds firms that license and deliver software over the internet by subscription, provide a platform to create software via internet, provide virtualized computing via internet, own or manage data centers or make or distribute related hardware. Firms must have revenue of at least 50% from these activities to make the cut. The index also allows any firm that earns more than $500M from such actions, regardless of revenue percentage. Aggregate exposure to such firms is capped at 10%. The index selects firms across the cap spectrum and in developed and emerging markets. It applies no additional filters beyond those defining the space. Stocks are cap-weighted.
Related funds
Classification
What's in the fund
Exposure type
Technology Services
Stock breakdown by region
Top 10 holdings
CLOU - ETF FOR THE FUTUREAfter the big drop in tech stocks in recent months, this etf, that follows cloud companies, is a very good investment option for those who look to the future...

Global X Cloud Computing ETF (CLOU)The Global X Cloud Computing ETF ran up 33 % from May 2021 to November 2021 and has given back nearly 90% of that gain.
Harmonically (Shark Pattern and ABCD) one could build as case for a pending reversal.
As this is a counter-trend trade I'd like to see evidence of a reverse both with momentum t

CLOUD reviewas per requested.
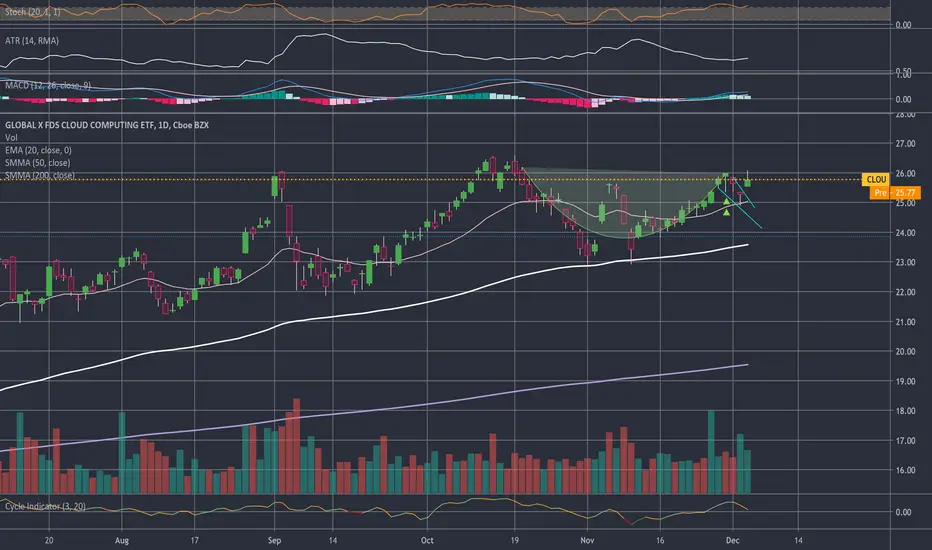
overall trend for CLOU is still uptrend..
as here we can see the market break above $29-30 and supported. (was previous resistance back on Dec)
BUT , we can see some divergence in MACD..
the high is getting higher, but in MACD, the high is getting lower ( can refer back what h

CLOU in UptrendCLOU
01/07/2021
Bounced from Demand Zone and heading to TP1.
If it can clear TP 1, there is ahigh possibility to hit TP2

Cloud computing looking goodI really like this ETF NASDAQ:CLOU and now is looking good. Is one of the leading tech industries due the higher demand for online solutions for everything, and I believe that is just getting started. It broke out of a symmetrical triangle with good buying volume and now is testing the 20 day MA w

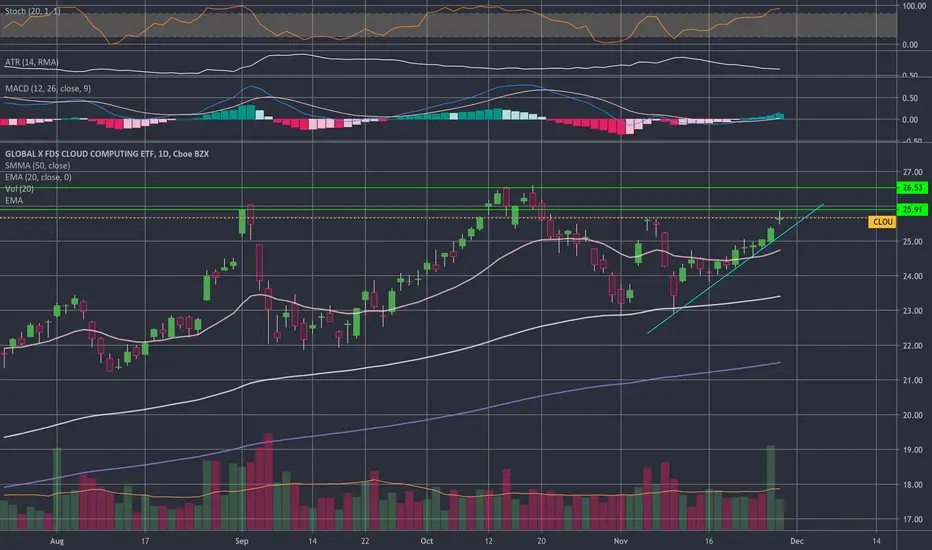
$CLOU - volume before price + cup and handleI have some calls on this, it just struggles to break that $26 barrier. Once it breaks out, it should melt up with some significant gains.
MACD, Stochastic and ATR are all supportive indicators along with volume over the past 2 days. There is also a cup and handle sort of formation taking place rig
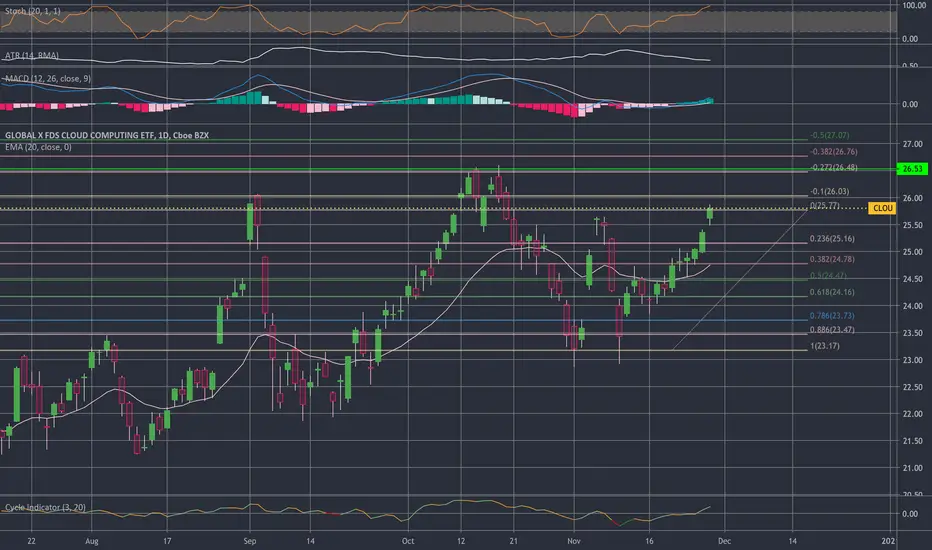
$CLOU - I think it's ready to go Have been waiting for this to cross 26 - however, 25.8 is the mark according to fib retracement
Watch for entry.
$CLOU - watch for the $26 breakWatching for entry when it breaks $26 and holds for an hour
Entering with call options
Panic sell to panic buy - the Cloud/SaaS ETFJust wow.
The Cloud/SaaS ETF went from a panic sale to a panic buy. It came happen both ways.

See all ideas
Summarizing what the indicators are suggesting.
Oscillators
Neutral
SellBuy
Strong sellStrong buy
Strong sellSellNeutralBuyStrong buy
Oscillators
Neutral
SellBuy
Strong sellStrong buy
Strong sellSellNeutralBuyStrong buy
Summary
Neutral
SellBuy
Strong sellStrong buy
Strong sellSellNeutralBuyStrong buy
Summary
Neutral
SellBuy
Strong sellStrong buy
Strong sellSellNeutralBuyStrong buy
Summary
Neutral
SellBuy
Strong sellStrong buy
Strong sellSellNeutralBuyStrong buy
Moving Averages
Neutral
SellBuy
Strong sellStrong buy
Strong sellSellNeutralBuyStrong buy
Moving Averages
Neutral
SellBuy
Strong sellStrong buy
Strong sellSellNeutralBuyStrong buy
Displays a symbol's price movements over previous years to identify recurring trends.
Frequently Asked Questions
An exchange-traded fund (ETF) is a collection of assets (stocks, bonds, commodities, etc.) that track an underlying index and can be bought on an exchange like individual stocks.
CLOU trades at 22.79 USD today, its price has fallen −0.09% in the past 24 hours. Track more dynamics on CLOU price chart.
CLOU net asset value is 22.32 today — it's fallen 5.50% over the past month. NAV represents the total value of the fund's assets less liabilities and serves as a gauge of the fund's performance.
CLOU assets under management is 305.86 M USD. AUM is an important metric as it reflects the fund's size and can serve as a gauge of how successful the fund is in attracting investors, which, in its turn, can influence decision-making.
CLOU price has fallen by −4.13% over the last month, and its yearly performance shows a 24.60% increase. See more dynamics on CLOU price chart.
NAV returns, another gauge of an ETF dynamics, have risen by −5.50% over the last month, have fallen by −5.50% over the last month, showed a 2.62% increase in three-month performance and has increased by 18.35% in a year.
NAV returns, another gauge of an ETF dynamics, have risen by −5.50% over the last month, have fallen by −5.50% over the last month, showed a 2.62% increase in three-month performance and has increased by 18.35% in a year.
CLOU fund flows account for −114.75 M USD (1 year). Many traders use this metric to get insight into investors' sentiment and evaluate whether it's time to buy or sell the fund.
Since ETFs work like an individual stock, they can be bought and sold on exchanges (e.g. NASDAQ, NYSE, EURONEXT). As it happens with stocks, you need to select a brokerage to access trading. Explore our list of available brokers to find the one to help execute your strategies. Don't forget to do your research before getting to trading. Explore ETFs metrics in our ETF screener to find a reliable opportunity.
CLOU invests in stocks. See more details in our Analysis section.
CLOU expense ratio is 0.68%. It's an important metric for helping traders understand the fund's operating costs relative to assets and how expensive it would be to hold the fund.
No, CLOU isn't leveraged, meaning it doesn't use borrowings or financial derivatives to magnify the performance of the underlying assets or index it follows.
In some ways, ETFs are safe investments, but in a broader sense, they're not safer than any other asset, so it's crucial to analyze a fund before investing. But if your research gives a vague answer, you can always refer to technical analysis.
Today, CLOU technical analysis shows the sell rating and its 1-week rating is buy. Since market conditions are prone to changes, it's worth looking a bit further into the future — according to the 1-month rating CLOU shows the buy signal. See more of CLOU technicals for a more comprehensive analysis.
Today, CLOU technical analysis shows the sell rating and its 1-week rating is buy. Since market conditions are prone to changes, it's worth looking a bit further into the future — according to the 1-month rating CLOU shows the buy signal. See more of CLOU technicals for a more comprehensive analysis.
CLOU trades at a premium (0.09%).
Premium/discount to NAV expresses the difference between the ETF’s price and its NAV value. A positive percentage indicates a premium, meaning the ETF trades at a higher price than the calculated NAV. Conversely, a negative percentage indicates a discount, suggesting the ETF trades at a lower price than NAV.
Premium/discount to NAV expresses the difference between the ETF’s price and its NAV value. A positive percentage indicates a premium, meaning the ETF trades at a higher price than the calculated NAV. Conversely, a negative percentage indicates a discount, suggesting the ETF trades at a lower price than NAV.
CLOU shares are issued by Mirae Asset Global Investments Co., Ltd.
CLOU follows the Indxx Global Cloud Computing Index. ETFs usually track some benchmark seeking to replicate its performance and guide asset selection and objectives.
The fund started trading on Apr 12, 2019.
The fund's management style is passive, meaning it's aiming to replicate the performance of the underlying index by holding assets in the same proportions as the index. The goal is to match the index's returns.