CLSK trade ideas

bullish confluenceClean Spark has analysts buy ratings, what are you waiting for ?, the AO is trending positive and a bull div on both the RSI and AO, expecting a bounce


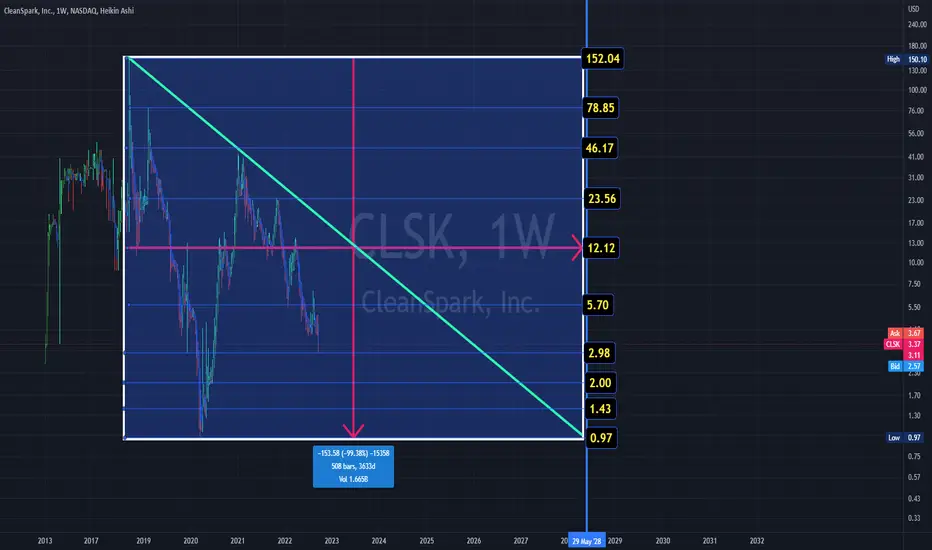
CLSK buy at market HODL stop loss $0CLSK buy at market HODL stop loss $0 I mean this thing got train wrecked.

CLSK High volumes with bullish divergence RSICLSK
keeping an eye on the next few days
High volumes with bullish divergence RSI

CLSK UPGRAIDS Chart on our random finds. he took a random bet on my charting and hit so now I have to create a trajectory for my boy.

CLSK Watched this last year and this retracement was insane from the run up. I broke the levels of importance. I like the Higher Low from the 99 percent drop and making a run up and maintaining good trend. If this current support line fails then we will retest the anchor point lower range.
Horizontal Channel Pattern look promising for $CLSK-Multiple bottom sitting at $3.74 area
-Potential 30% rise to $5 in the mid-term
-Pattern looks promising considering S/R lines hit multiple times
-Long Term Target is $10 but we now wait for volume
As always, DYOR
Let me know what you think in the comments!

Patterns Within Patterns (Head and Shoulders) Larger head and shoulders in orange
The head constitutes both the larger Head and shoulders and also the smaller one, which contains the white shoulders
Interesting Inverted H&S Pattern

$CLSK ~ Interesting...As shown in previous update, correction continues and expect lower prices as shown. Possible opportunity soon but not yet. Will be interesting soon and will continue to track closely.

$CLSK cleaning mining 👁🗨*This is not financial advice, so trade at your own risks*
*My team digs deep and finds stocks that are expected to perform well based off multiple confluences*
*Experienced traders understand the uphill battle in timing the market, so instead my team focuses mainly on risk management
My team purchased shares of digital mining bitcoin company CleanSpark $CLSK today at $5.35 per share. Our take profit is set at $9
Hello guys! This week a new crypto bill has been the main topic of focus inside of the crypto world. NY has also passed a crypto bill which will ban crypto mining via fossil fuels. $CLSK is way ahead of other bitcoin miners and has been building grids which will allow crypto to be mined without using fossil fuels.
Our entry: $5.35
Target: $9.00
If you want to see more, please like and follow us @SimplyShowMeTheMoney

:) helloDamn i bought this at 7.5 something an didnt sell when i was up like with 40% damn, this is just a fallen knife looks like it will go to 3,5$ or more scary 1.20$ ? this is just crazy i dont have more money :-/ i was up like 117% last year dont even wanna say whAt is this year, thx all gov. for ruining the economy with you fake pandemi, they want or money an us to obey them thats the problem.
Freedom forever V

$CLSK another cycle 👁🗨*This is not financial advice, so trade at your own risks*
*My team digs deep and finds stocks that are expected to perform well based off multiple confluences*
*Experienced traders understand the uphill battle in timing the market, so instead my team focuses mainly on risk management
My team purchased shares of digital mining bitcoin company CleanSpark $CLSK today at $7 per share. Our take profit is set at $12
Our entry: $7
Target: $12
If you want to see more, please like and follow us @SimplyShowMeTheMoney

$CLSK morning dip buy up 👁🗨*This is not financial advice, so trade at your own risks*
*My team digs deep and finds stocks that are expected to perform well based off multiple confluences*
*Experienced traders understand the uphill battle in timing the market, so instead my team focuses mainly on risk management
The crypto market is at its loading zone. My team is loading up shares of crypto related companies that we believe will surely benefit from this rally.
Today my team purchased shares of clean-energy software and bitcoin mining company $CLSK at $10.30 per share. Our first target is $12.50
Our entry: $10.30
Target 1: $12.50
Target 2: $9.75
If you want to see more, please like and follow us @SimplyShowMeTheMoney

$CLSK sold our shares with a 21% gain 👁🗨*This is not financial advice, so trade at your own risks*
*My team digs deep and finds stocks that are expected to perform well based off multiple confluences*
*Experienced traders understand the uphill battle in timing the market, so instead my team focuses mainly on risk management
Recap: My team purchased shares of digital mining bitcoin company CleanSpark $CLSK at $10.30 per share on March 3, 2022.
We sold our $CLSK shares today at $12.50 for a gain of 21%.
Thank you all for sticking with us through this trade despite us hitting our stop loss on this trade early on. We held through and have been rewarded nicely!
Congrats to those of you who took this trade!
Our entry: $10.30
Target (HIT): $12.50
If you want to see more, please like and follow us @SimplyShowMeTheMoney

CLSK Moving to ~$17CLSK has broken out of the box it's been trading in for the past couple of weeks (Bounced off Weekly SR level and broke above the Monthly). I am assuming the Monthly SR level will hold due to it being near a high volume area, and am expecting it to go to the next volume area which is ~$17. I could also see this getting in the 20s or more depending on how BTC moves.

$CLSK target reached with an 18% gain 👁🗨*This is not financial advice, so trade at your own risks*
*My team digs deep and finds stocks that are expected to perform well based off multiple confluences*
*Experienced traders understand the uphill battle in timing the market, so instead my team focuses mainly on risk management
Recap: My team purchased shares of clean-energy software and bitcoin mining company $CLSK at $7.40 per share on 1/19/22
My team adjusted our previous take profits today 8 hours ago because we figured that $CLSK may jump after earnings, but we weren't too sure whether or not it could hold those gains. We set the take profit to $8.75, and we are happy to announce that the target has been reached!
Congrats to those of you who took this trade! We exited $CLSK with a total gain of 18.24%!
OUR ENTRY: $7.40
TAKE PROFIT(HIT): $8.75
If you want to see more, please like and follow us @SimplyShowMeTheMoney

$CLSK spark up 👁🗨*This is not financial advice, so trade at your own risks*
*My team digs deep and finds stocks that are expected to perform well based off multiple confluences*
*Experienced traders understand the uphill battle in timing the market, so instead my team focuses mainly on risk management
The crypto market is at its loading zone. My team is loading up shares of crypto related companies that we believe will surely benefit from this rally.
Today my team purchased shares of clean-energy software and bitcoin mining company $CLSK at $7.40 per share. Our first target is $13.50
Our entry: $7.40
Target 1: $13.50
Target 2: $20.25
If you want to see more, please like and follow us @SimplyShowMeTheMoney

must break that trend resistance first! clsk is sitting right above a big support zone, It continues to get rejected by top trendline resistance which is not a great sign!
wait for a breakout of top trendline if you want a long positon, stop loss below support zone.
like and follow for more 💘

CLSK maybe bottomed out.CLSK has been a favorite of mine that has bought some nice gains early on, but as of late it has been beaten down like many stocks have. Shoutout to Rex finance for breaking down this company in detail and i have been averaging down on my position. Looking at the chart it seems like we may have bottomed out and could be seeing a move up gradually. RSI is indicating oversold, while the MACD looks to be widening green. CLSK is a great company that uses clean energy to mine bitcoin which seems to be the only company using clean energy. Long on this company.

Positioned for EntryWith crypto being beat down, and eventually ramping back up, this stock is sitting right above its 52- Week Low. This is a nice entry level and a chance to grab some cheap ITM longterm leaps. All this is based on me dreaming that I wish i knew what i was talking about...
Indicators used: Cheat Code Algo, CCA Swing, Swing High Low Support & Resistance

CLSK Bear ContinuationAn idea for CLSK
A strong convergence point for price can be seen as the cause for the recent breakout, that along with a falling wedge
This will likely be short lived, and bear continuation will prevail in the long term

clsk w5 swingafter some contemplation, i have to lean bullish on clsk.
i recently called the bottom and it's run up like 100% since then, view the post down below.
-----
here's another little setup for the final fifth wave to put in wave (1) of a higher degree of the final fifth wave of an even higher degree.
my upside target for this trade is at $28
