$CRWV: Reversal Brewing or More Pain Ahead?🧠 NASDAQ:CRWV – Technical Analysis (Daily Timeframe)
CoreWeave is currently trading at $104.14, sitting at the lower end of a well-defined descending channel after a steep selloff (-8.75% today). Volume is spiking, suggesting growing interest — whether that's accumulation or distribution is the key to watch next.
📉 Descending Channel Breakdown
Upper trendline = breakout trigger
Lower trendline = breakdown trapdoor
🟡 Midline of the channel = key decision zone (dynamic resistance/support)
Acts like a battlefield: bulls want to flip it, bears want to reject it.
CRWD has been respecting the midline as resistance — until price reclaims and holds above it, trend remains bearish.
If we break above the midline with volume, that’s early confirmation of strength before even touching the top of the channel.
🟢 Long Setup (Breakout Play)
Trigger: Break & close above channel top (~$110+)
Confirmation: Reclaim midline, convert it to support
Targets:
$120 local supply
$140 minor inefficiency
$186 gap-fill + key supply zone
🔴 Short Setup (Breakdown Play)
Trigger: Break & close below lower trendline (~$100 or under)
Confirmation: Fail to reclaim midline on bounce
Targets:
$85 psychological zone
$64.82 demand level
📊 Indicators
MACD: Bearish, but curling. A bullish cross on a midline reclaim = fuel.
RSI: Near oversold, showing early divergence = potential bounce
Volume: Big pop today — first real signal buyers/sellers are clashing hard.
🎯 Key Takeaway:
✅ Break & close above midline → early strength
✅ Break & close above channel → CONFIRMED BUY
❌ Close below lower channel → HIGH-PROBABILITY SHORT
❓ Rejections at midline → continue fading pops until proven wrong
CRWV trade ideas

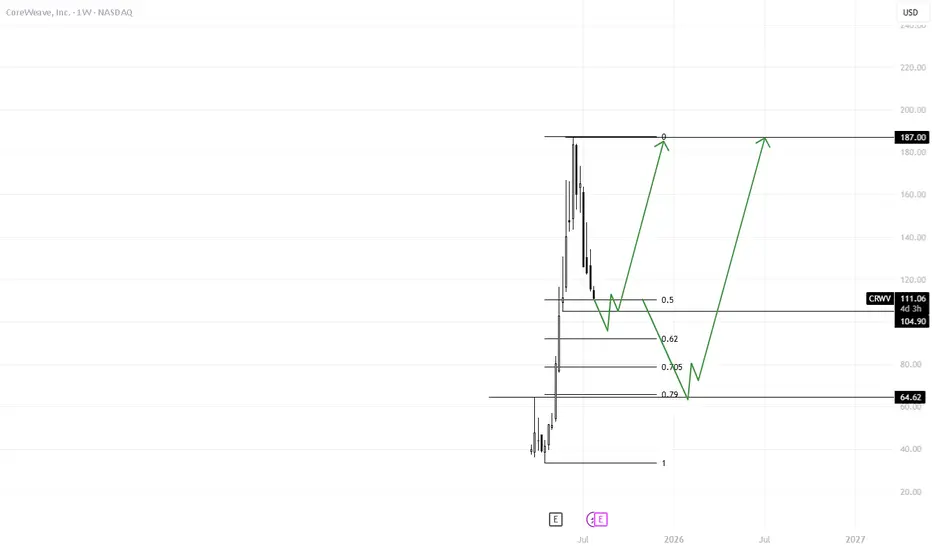
CRWVExpecting Bullish price action at 100$ level. If break of structure is noted and maintained I see upside targets remaining 189$. Second Scenario is Price falls to the 60$ level then shows bullish price action.
CRWV still crashing... breaking $100?whew.... will we break $100?
*failed 110
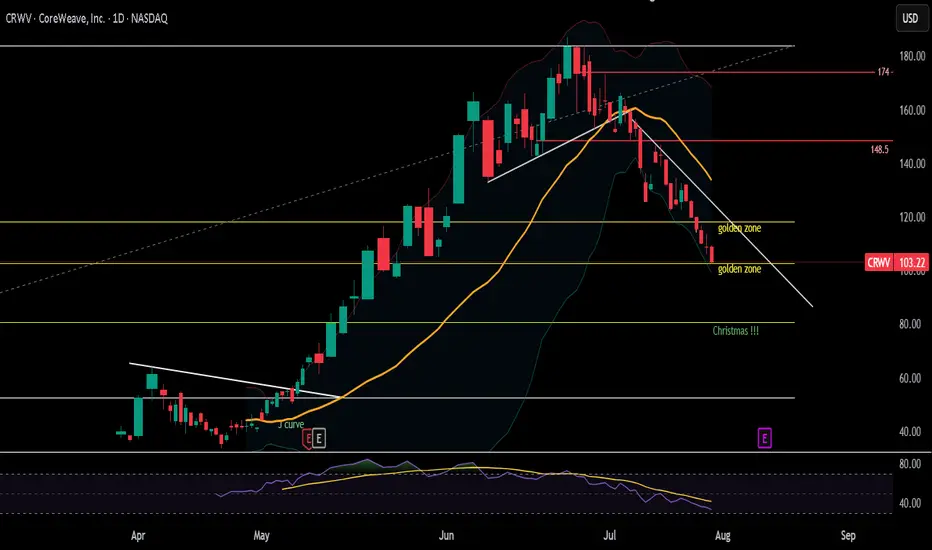
well i have a christmas fib outlined. i think i'll do a little investigating on this stock. popped due to its connection to NFLX. let's see what is going on before we buy the dip.
CRWV - THE MOMENT OF TRUTH📰 CoreWeave (CRWV) — Technical & Macro Update
Ticker: CRWV | Chart Timeframe: 30-min | Current Price: $115.62
Sector: AI Infrastructure / Data Centers
Date: July 26, 2025
⚡ Market Recap
CoreWeave was in the spotlight this week following two key developments:
🏗️ $7 Billion Lease Deal: Entered two 15-year AI data center agreements with Applied Digital (APLD), expected to generate $7B in top-line revenue. This solidifies long-term client infrastructure demand and recurring income.
💸 Debt Load Grows: Issued $1.75B in 9% bonds, raising concerns over capital intensity and financing strategy. Total projected capex through 2025 is $20–23B, requiring significant additional funding.
📉 HSBC Slashes Price Target: HSBC initiated coverage with a sell rating and an aggressive price target of $32 — a 72% downside from current levels. The firm cited:
Unsustainable customer concentration (Microsoft makes up ~60% of revenue)
High financial leverage
Risk of multiple compression as AI hype cools
Despite bullish sentiment from lease news, the downgrade weighed on investor confidence, pushing shares into a tight range.
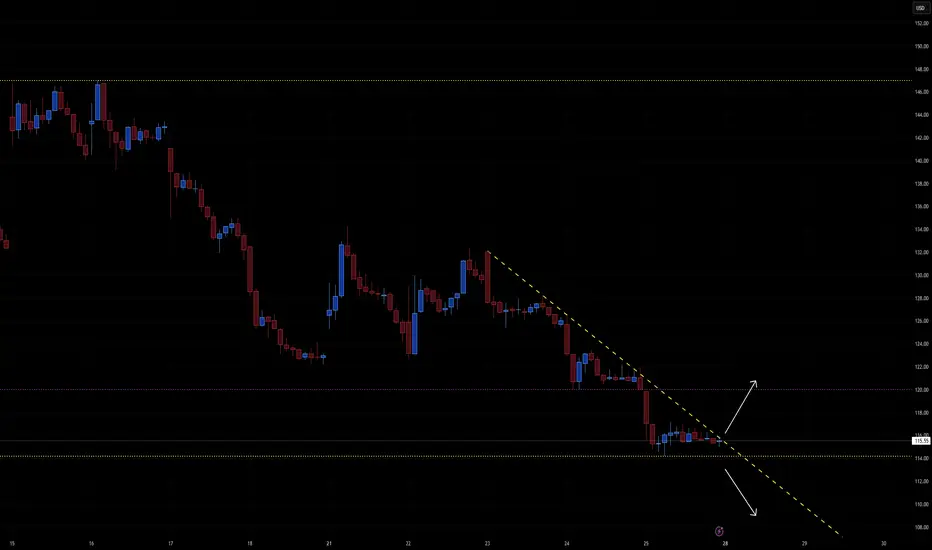
🔍 Chart Technical Outlook
Structure Summary:
Price has compressed under a descending trendline
Trading between $114.00 (support) and $118.50 (resistance)
Price action is setting up for a breakout or breakdown
✅ Bullish Setup
Breakout Level: $118.50+
Short-Term Targets: $122 → $126 → $130
Tailwinds:
Long-term lease revenue visibility
Strong Q1 growth (+420% YoY)
Core partners: OpenAI, Mistral, Microsoft
❌ Bearish Breakdown
Breakdown Level: $114.00
Targets: $110 → $106.50
Headwinds:
$12B+ in debt, rising interest costs
Analyst downgrade to $32 price target
Customer concentration and margin risk
🧠 Strategic Takeaway
CoreWeave is perched at a critical level. While bulls are encouraged by long-term deals and market share in AI compute, bears are becoming louder following HSBC’s stark warning.
Play the breakout—but know the macro backdrop. A move above $118.50 opens upside, but failure below $114 could confirm bears' thesis.
CRWV earnings pop perhapsIt's a buy for many. Consolidating nicely. Doesn't look like we will make it to the Christmas fib level .786
Earnings is next week and I think it can do well.
APLD announced a major partnership during their earnings call. They have contract(s) with NVDA. What else is going on pop worthy?
Close Targets: 125, 135
Great earnings... 145+?
SL 99; or tight at 103

CRWV: Week of July 21Sharing my analysis on NASDAQ:CRWV for next week.
As always, not advice just opinions.
Safe trades and take care!

Coreweave retesting supportAfter a recent pop off the support line, it looks like the stock will retest these levels. Also, note the clear H&S pattern over the last several months. I'm expecting a breakdown below support in the next week or two.
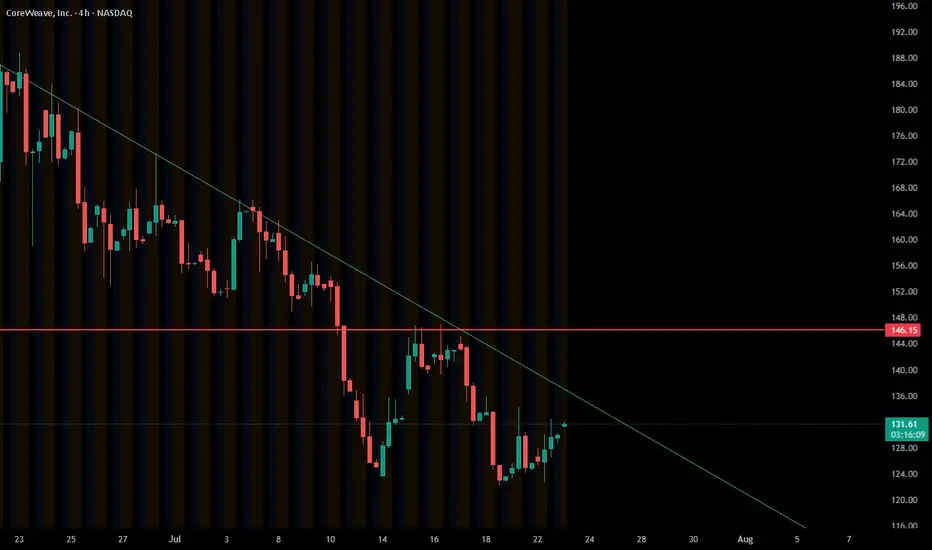
CRWV retest incoming?will we retest 130?
That's my bet. I'm sure that Fri 7/18 will be wild as it is the monthly contract. Staying below 140, I'll hold my runners.
After this bottom, I think we will reverse back upward to 145+

Weekly Equities Trade Idea: CRCL Puts (Update)Hello Traders!
I'm providing an update to the CRCL trade idea from Monday July 14th. Here's what I'm watching:
- Price to open within the range from Tuesday July 15th
- Potential imbalance resolve from Monday July 14th at $204.70
- If price breaks Friday July 11th's high at $206.80 the trade is invalidated
Cheers,
DTD

Short-term Bear Case for CRCLHello Traders!
As part of my weekly equity trade analysis, I will be uploading my recordings of what I am seeing and intending to trade for the week. A quick summary of what's in the video is as follows:
- CRCL is a high beta stock that seems to not be moving in tandem with its peers as of late
- I am expecting volatility due to market data and monthly options expiration
- CRCL has formed a new bearish order block below another bearish order block and is wedged with a weekly bearish setup. We are anticipating expansion out of this range to the downside
- I am waiting for a re-test of $199-$205 for a full move to $155-$145
Cheers,
DTD

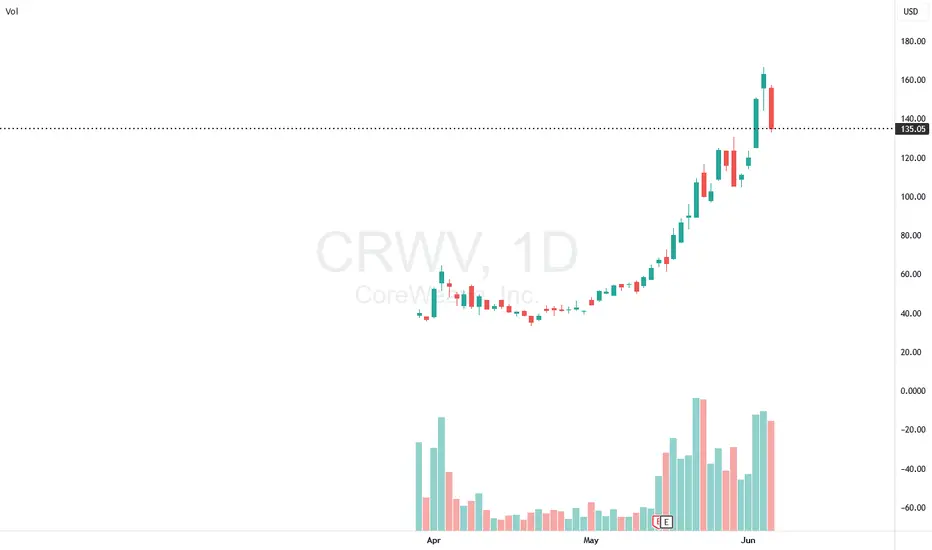
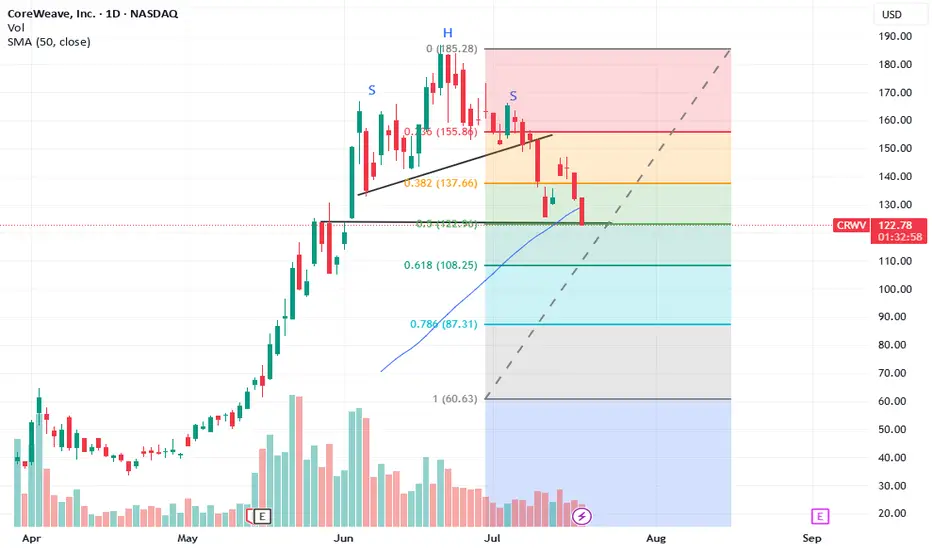
WHAT GOES UP MUST COME DOWN wants to close daily gap at $123.66CRWV forms ‘Head and Shoulders’ on the daily over the past month. The breakout to $180s is all I saw a month ago…but now a reversal has started to $123.66 and maybe to $111.95 as the worse case scenario. My daughter made me hold on to this one like she did on Nvidia. She was right on that one….but she is 45 and I am 82. She has more time to wait it out than me. CRWV has taken the path of many IPOs….it pulls up right after coming out of the gate. Regains its footing and starts to move (using horse racing terminology) Great speed rating, so she gains ground in the first turn. Still improving her time down the backstretch as she breaks the $100 mark by middle of May and gaining momentum. She continues to pass horses and moves into the lead as they reach the 1/4 pole. By now it’s apparent that CRWV is a closer as she demonstrates moving down the last eighth of a mile. As she roars up the home stretch 8 lengths ahead of the field closing above $180.
Unfortunately her next race is dismal as she forms a ‘head and shoulder’ pattern. From here it’s all downhill until she reaches $123.66 …..or worse $111.95


CRWV is crash this weeklast 3 days closed below 21 ema. under 50 on daily RSI. head/shoulders below 145 may breach 140 this week? looks like it. i'm gonna make the play.
148 SL

BEST STOCK IN THE WORLDBest stock in the world with the best tech for AI; bought a ton at 150-162 USD
This stock will 100x easy

CRWV high tight flag pattern we have a breakout setting up at 162 ive taken a position at the open with a stop under 154 this is the best pattern in the market.
WE have huge momo the last month now we have the first consolidation in the run. It shoudl get bought as the fomo kicks in,

Who Silently Powers the AI Revolution?While the spotlight often shines on AI giants like Nvidia and OpenAI, a less-publicized but equally critical player, CoreWeave, is rapidly emerging as a foundational force in the artificial intelligence landscape. This specialized AI cloud computing provider is not just participating in the AI boom; it is building the essential infrastructure that underpins it. CoreWeave's unique model allows companies to "rent" high-performance Graphics Processing Units (GPUs) from its dedicated cloud, democratizing access to the immense computational power required for advanced AI development. This strategic approach has positioned CoreWeave for substantial growth, evidenced by its impressive 420% year-over-year revenue growth in Q1 2025 and a burgeoning backlog of over $25 billion in remaining performance obligations.
CoreWeave's pivotal role became even clearer with the recent partnership between Google Cloud and OpenAI. Though seemingly a win for the tech titans, CoreWeave is supplying the critical compute power that Google then resells to OpenAI. This crucial, indirect involvement places CoreWeave at the nexus of the AI revolution's most significant collaborations, validating its business model and its capacity to meet the demanding computational needs of leading AI innovators. Beyond merely providing raw compute, CoreWeave is also innovating in the software space. Following its acquisition of AI developer platform Weights & Biases in May 2025, CoreWeave has launched new AI cloud software products designed to streamline AI development, deployment, and iteration, further cementing its position as a comprehensive AI ecosystem provider.
Despite its rapid stock appreciation and some analyst concerns about valuation, CoreWeave's core fundamentals remain robust. Its deep partnership with Nvidia, including Nvidia's equity stake and CoreWeave's early adoption of Nvidia's cutting-edge Blackwell architecture, ensures access to the most sought-after GPUs. While currently in a heavy investment phase, these expenditures directly fuel its capacity expansion to meet an insatiable demand. As AI continues its relentless advancement, the need for specialized, high-performance computing infrastructure will only intensify. CoreWeave, by strategically positioning itself as the "AI Hyperscaler," is not just witnessing this revolution; it is actively enabling it.

6/17/25 - $crwv - Short again6/17/25 :: NASDAQ:CRWV :: VROCKSTAR
Short again
- much easier to find shorts in this tape
- these guys don't make money when you take out capex
- it's like bitcoin mining, without the bitcoin
- go figure. eat your heart out normies.
i'm short, again. send it higher about 2%. prefer 5% size.
enjoy the bearish divergence on the daily.
V


Where is $CRWV headed to?CoreWeave (NASDAQ: CRWV):
Pros
Explosive revenue growth
-Q1 2025 revenue surged 420% year-over-year to $981.6 million, up from $188.7 million.
-Consensus expects revenue could double in 2025 and reach $16 billion by 2027.
High adjusted EBITDA margins
-Adjusted EBITDA margin around 62% in Q1 and ~64% for 2024.
Strategic customer contracts
-$11.9 b OpenAI deal and partnership with Google Cloud to support OpenAI workloads.
-$7 b lease agreement with Applied Digital over 15 years.
Backed by top-tier capital providers
-Investors include Nvidia, Microsoft, Blackstone, Magnetar, Fidelity.
-IPO raised $1.5 b even after scaling down, plus interest in refinancing $1.5 b debt.
Market leadership in GPU cloud
-Positioned as a “neocloud” AI infrastructure powerhouse, offering specialized high-performance GPU services to hyperscalers.
Cons
-Massive capital intensity & debt
-Carried ~$8 b in debt as of end-2024; raising more to refinance high-yield credit.
-Depreciation and interest charges weigh on GAAP profits
GAAP losses remain significant
-Q1 net loss of $314 million due to high depreciation/interest; GAAP net loss margin ~32%.
-Non-cash adjusted figures hide underlying capital burn.
Customer concentration risk
-Microsoft accounted for ~62% of 2024 revenue; OpenAI and Google help diversify, but client dependency remains.
IPO headwinds & pricing struggles
-IPO priced at\$40 (reduced from $47–55).
-Seen as largest tech IPO since 2021, but faced investor concerns over sustainability.
Valuation and competition concerns
-Stock is up ~250–300% since IPO—possible bubble risk.
-Faces competition from Big Tech hyperscalers and other AI compute providers
-Disclaimer: This analysis is for informational and educational purposes only and does not constitute financial advice, investment recommendation, or an offer to buy or sell any securities. Stock prices, valuations, and performance metrics are subject to change and may be outdated. Always conduct your own due diligence and consult with a licensed financial advisor before making investment decisions. The information presented may contain inaccuracies and should not be solely relied upon for financial decisions. I am not personally liable for your own losses, this is not financial advise.

Ascending TriangleLook for upcoming breakout to the upside. If you know how to calculate the breakout than I don’t need to explain it.

CRWV eyes on $96.08: Golden Genesis fib Ends 60% trade now DIP? Our last plot (see below) gave a nice 66% gain.
Now looking for a decent dip to re-enter longs.
Each fib below is of interest, especially Goldens.
Previous trade that just closed with 66% gains
=============================================
.

Hype-Fueled Uptrend Likely Exhausted, Gradual Reversion ExpectedCoreWeave, Inc. (Ticker: CRWV) has experienced a sharp and extended bullish run driven largely by market enthusiasm and speculative hype. However, current technical indicators suggest that this uptrend has reached a point of exhaustion and a reversion to mean is highly probable.
Key Observations:
Price Action:
The recent parabolic rise appears unsustainable, with signs of weakening momentum in the latest candles (notably a tall upper wick indicating selling pressure at highs).
Price has moved significantly away from key moving averages, creating a wide gap that historically resolves with a pullback.
Market Sentiment:
The stock's trajectory reflects a hype-driven narrative, likely fueled by AI/data center exposure headlines.
Sentiment-driven rallies often overshoot fundamentals and correct sharply once speculative demand cools.
Trading Idea:
We propose a short-term bearish trading setup, targeting a gradual retracement toward the $65 support zone, which aligns with a key volume shelf and prior consolidation range. This zone represents a more stable "base" from which the stock could rebuild after profit-taking and sentiment normalization.