Cisco Systems (NASDAQ: $CSCO) Drips Under Golden Pocket! 💧Cisco Systems, Inc. designs, manufactures, and sells Internet Protocol based networking and other products related to the communications and information technology industry in the Americas, Europe, the Middle East, Africa, the Asia Pacific, Japan, and China. It provides infrastructure platforms, including networking technologies of switching, routing, wireless, and data center products that are designed to work together to deliver networking capabilities, and transport and/or store data. The company also offers collaboration products comprising unified communications, Cisco TelePresence, and conferencing, as well as the Internet of Things and analytics software. In addition, it provides security products, such as network security, cloud and email security, identity and access management, advanced threat protection, and unified threat management products. Further, the company offers a range of service and support options for its customers, including technical support and advanced services. It serves businesses of various sizes, public institutions, governments, and service providers. The company sells its products and services directly, as well as through systems integrators, service providers, other resellers, and distributors. Cisco Systems, Inc. has strategic alliances with other companies. Cisco Systems, Inc. was incorporated in 1984 and is headquartered in San Jose, California.
CSCO trade ideas

CSCO - Similar Double TopsCSCO has formed similar double tops
I expect price from the second double top to fall to the red horizontal line
This represented an equal drop as the first double top

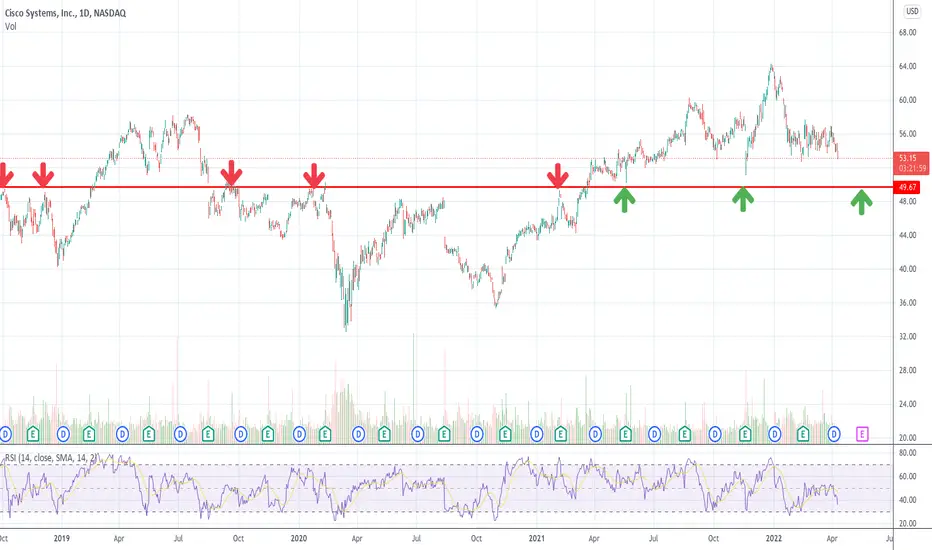
Cisco at support?Cisco System s
Short Term
We look to Buy at 41.75 (stop at 40.34)
This stock has recently been in the news headlines. Further upside is expected although we prefer to buy into dips close to the 42.00 level. Trading close to the psychological 40.00 level. Posted a Bullish Hammer Bottom on the Daily chart.
Our profit targets will be 45.31 and 52.00
Resistance: 44.00 / 45.00 / 50.00
Support: 42.00 / 36.50 / 30.00
Disclaimer – Saxo Bank Group. Please be reminded – you alone are responsible for your trading – both gains and losses. There is a very high degree of risk involved in trading. The technical analysis, like any and all indicators, strategies, columns, articles and other features accessible on/though this site (including those from Signal Centre) are for informational purposes only and should not be construed as investment advice by you. Such technical analysis are believed to be obtained from sources believed to be reliable, but not warrant their respective completeness or accuracy, or warrant any results from the use of the information. Your use of the technical analysis, as would also your use of any and all mentioned indicators, strategies, columns, articles and all other features, is entirely at your own risk and it is your sole responsibility to evaluate the accuracy, completeness and usefulness (including suitability) of the information. You should assess the risk of any trade with your financial adviser and make your own independent decision(s) regarding any tradable products which may be the subject matter of the technical analysis or any of the said indicators, strategies, columns, articles and all other features.
Please also be reminded that if despite the above, any of the said technical analysis (or any of the said indicators, strategies, columns, articles and other features accessible on/through this site) is found to be advisory or a recommendation; and not merely informational in nature, the same is in any event provided with the intention of being for general circulation and availability only. As such it is not intended to and does not form part of any offer or recommendation directed at you specifically, or have any regard to the investment objectives, financial situation or needs of yourself or any other specific person. Before committing to a trade or investment therefore, please seek advice from a financial or other professional adviser regarding the suitability of the product for you and (where available) read the relevant product offer/description documents, including the risk disclosures. If you do not wish to seek such financial advice, please still exercise your mind and consider carefully whether the product is suitable for you because you alone remain responsible for your trading – both gains and losses.

CSCO ShortWithout a recession a lot has been discounted in the market already, but I would not fight the Fed and the tape. We are likely getting close to a trading low, but it may take more selling to get there. Short pilot position.

CSCO $CSCO High-risk Initial LongCSCO $CSCO High-risk Initial Long. SL and TP on chart. Move SL on TP.

CSCOBreaking the current trend of the range upwards.. it makes us consume a distance of 12 days until we are in the areas of $49-$50. stop=44.50$


$CSCO Looking for a gap fill My target on this play 48.26 looking for a solid pullback before entry... This chart speaks for itself not much explanation needed


Lower aa bit more?Price dropped sharply yesterday ! Might probably go a bit lower to touch the long term up trend line! I will wait to see IF and What happen at that level ! It might represent a good buy for long term investors (3-5 years horizon) Just my opinion :)

$CSCO with a Bearish outlook following its earnings #Stocks The PEAD projected a Bearish outlook for $CSCO after a Negative Under reaction following its earnings release placing the stock in drift D with an expected accuracy of 50%.

Cisco: Another Bargain Hunt?!!Cisco Systems
Short Term - We look to Buy at 40.15 (stop at 37.59)
This stock has recently been in the news headlines. They reported earnings and missed quarterly revenue estimates. This has resulted in signals for sentiment being at oversold extremes and we look for a move to the upside. Trading close to the psychological 40.00 level. Further upside is expected although we prefer to set longs at our bespoke support levels at 40.00, resulting in improved risk/reward.
Our profit targets will be 49.99 and 52.00
Resistance: 44.00 / 46.00 / 48.00
Support: 40.00 / 38.00 / 36.00
Please be advised that the information presented on TradingView is provided to Vantage (‘Vantage Global Limited’, ‘we’) by a third-party provider (‘Signal Centre’). Please be reminded that you are solely responsible for the trading decisions on your account. There is a very high degree of risk involved in trading. Any information and/or content is intended entirely for research, educational and informational purposes only and does not constitute investment or consultation advice or investment strategy. The information is not tailored to the investment needs of any specific person and therefore does not involve a consideration of any of the investment objectives, financial situation or needs of any viewer that may receive it. Kindly also note that past performance is not a reliable indicator of future results. Actual results may differ materially from those anticipated in forward-looking or past performance statements. We assume no liability as to the accuracy or completeness of any of the information and/or content provided herein and the Company cannot be held responsible for any omission, mistake nor for any loss or damage including without limitation to any loss of profit which may arise from reliance on any information supplied by Signal Centre.

Cisco Systems, Inc. (CSCO) Big Revenue Miss, Cuts GuidanceRevenue $12.84Bil vs $13.34Bil estimate!
Revenue forecast up more than $1 billion short of Wall Street expectations!
The inability to get power supplies out of China due to lockdown made Cisco lose $300Mil.
Another $200 were lost because of Russia`s war.
My buy area is around $41.
Looking forward to read your opinion about it.

$CSCO Now Back to Pre-Pandemic Prices After Earnings Miss!Cisco Earnings:
FQ3 Non-GAAP EPS of $0.87 beats by $0.01.
Revenue of $12.84B (+0.3% Y/Y) misses by $500M.
Price back to pre-pandemic drop!
Dividend yield now over 3.5%
No position...I just found this interesting.

Example of a bubble burstHere is an example of how a bubble burst can be felt over decades.
Making this for BTC/ETH traders that think that everything will come back up one day soon.
This is CSCO over the last 25 years

Probably lowerPrice is testing or breaking below the 50 area at the time of writing and if confirmed over the next few trading days, price should go down at least to test the long term up trend line ! Just my opinion :)

Presuming to kill
The harm of subjective transaction
Self-analysis of trading also deserves special mention. One stupid mistake leads to another stupid mistake and it becomes a vicious circle. At this point, the trader learns to let go. Subjective traders in particular should let go. Subjective decisions are more likely to be negatively affected by emotions. Sometimes traders feel trapped. When that happens (not "if"), it's best to suspend trading. Remember, there will be trading opportunities next month, next quarter, next year.
The Importance of Confidence
My experience is financial trading like a professional sport. Professional sports players are open and honest about their commitment. How many times have you heard statements like, "This athlete is in great shape," "he has great confidence," "He is too nervous on the court"?
Maybe you've considered all the possible scenarios in your trading plan, but you still have doubts and you still don't have confidence, so you don't trust the system completely. Cancer and heart disease are the two biggest killers of American health, and doubt and hesitation are the two biggest killers of sound trading plans.

CSCOIt has crossed the shaded area as shown on the chart. The targets are from it, we enter a correction to its maximum limits. It is clear on the chart, including a bullish wave. The analysis cancels when the third area is broken by closing a 3-hour candle below it or closing above the third target, an hourly candle.

CISCO testing meaningful supportCisco could rotate higher from here if this support holds, if it doesn't there's additional meaningful support not much further than where we currently are trading.


Lower!Price should be on its way to the 50 area where it may find support! It also looks like we could have a head & shoulder top formation in place, even though not perfect! Just my opinion
Cisco Selloff Incoming? Cisco Systems
Short Term - We look to Sell a break of 53.44 (stop at 54.96)
There was little net movement as we continue to consolidate within the 54.00 - 57.00 range. Mild losses have been posted and our bias turns to the downside. We look for losses to be extended today. Further downside is expected, however, due to the strong support below we prefer to sell a break of 53.44, which will confirm the bearish sentiment.
Our profit targets will be 48.49 and 44.77
Resistance: 57.00 / 60.00 / 70.00
Support: 54.00 / 50.00 / 48.00
Disclaimer – Saxo Bank Group. Please be reminded – you alone are responsible for your trading – both gains and losses. There is a very high degree of risk involved in trading. The technical analysis, like any and all indicators, strategies, columns, articles and other features accessible on/though this site (including those from Signal Centre) are for informational purposes only and should not be construed as investment advice by you. Such technical analysis are believed to be obtained from sources believed to be reliable, but not warrant their respective completeness or accuracy, or warrant any results from the use of the information. Your use of the technical analysis, as would also your use of any and all mentioned indicators, strategies, columns, articles and all other features, is entirely at your own risk and it is your sole responsibility to evaluate the accuracy, completeness and usefulness (including suitability) of the information. You should assess the risk of any trade with your financial adviser and make your own independent decision(s) regarding any tradable products which may be the subject matter of the technical analysis or any of the said indicators, strategies, columns, articles and all other features.
Please also be reminded that if despite the above, any of the said technical analysis (or any of the said indicators, strategies, columns, articles and other features accessible on/through this site) is found to be advisory or a recommendation; and not merely informational in nature, the same is in any event provided with the intention of being for general circulation and availability only. As such it is not intended to and does not form part of any offer or recommendation directed at you specifically, or have any regard to the investment objectives, financial situation or needs of yourself or any other specific person. Before committing to a trade or investment therefore, please seek advice from a financial or other professional adviser regarding the suitability of the product for you and (where available) read the relevant product offer/description documents, including the risk disclosures. If you do not wish to seek such financial advice, please still exercise your mind and consider carefully whether the product is suitable for you because you alone remain responsible for your trading – both gains and losses.
