MY CSX PLAY I'm expecting a similar drop on CSX as the CADJPY. Might open a bear call spread on CSX next week
CSX trade ideas

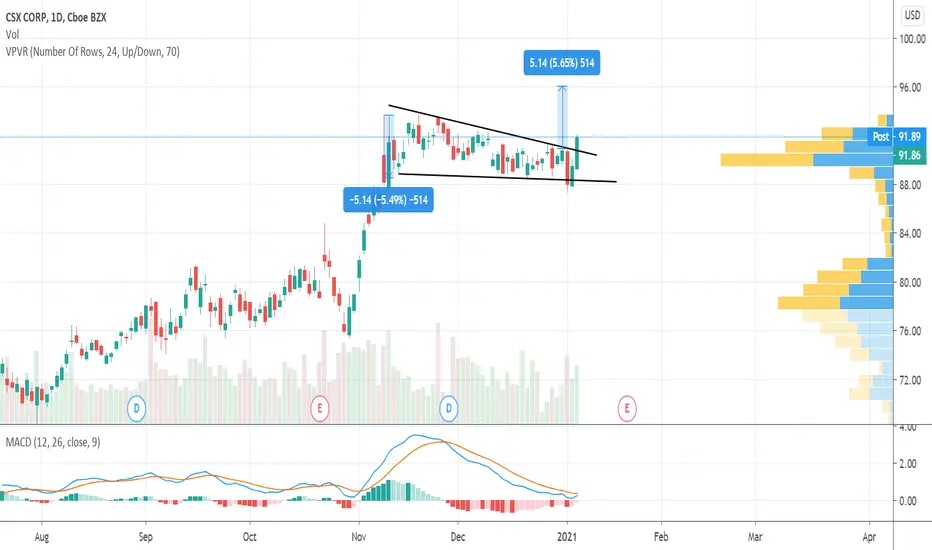
Is CSX Ready to Start Rolling?Railroad operator CSX has squeezed into a tight range for almost five months. Now it may be ready for a breakout.
The first pattern jumping off the chart is the ascending triangle with resistance around $95. Prices just started to escape the top yesterday.
Also notice how the lows on January 27, March 4 and March 19 were followed by “kicker” candlestick patterns. Those snapbacks show buyers didn’t let the stock remain down for long.
Next, Bollinger Band Width has tightened during this time, creating the potential for expansion if CSX starts running.
Third, prices have recently consolidated above the 8-day exponential moving average (EMA), the 21-day EMA and the 50-day simple moving average (SMA).
Finally, MACD has just turned positive.
In addition to those technicals, CSX is a transportation stock: the type of cyclical company that can benefit as economy recovers from the pandemic.
TradeStation is a pioneer in the trading industry, providing access to stocks, options, futures and cryptocurrencies. See our Overview for more.

CSX breakout above 50day SMACSX is back above the 50 day moving average and should be gaining momentum in near future. With call options, I'm lookin for the stock go back to all time highs.
Tech info:
RSI is above 50 and is trending higher (this is really good)
The stock has been trading sideways and down for a long period of time approximately 3 months which improves this trading probability.
Lastly, the has good momenetum (above 20 ema, 85 ema, and above 50 sma.
I am long calls on CSX.

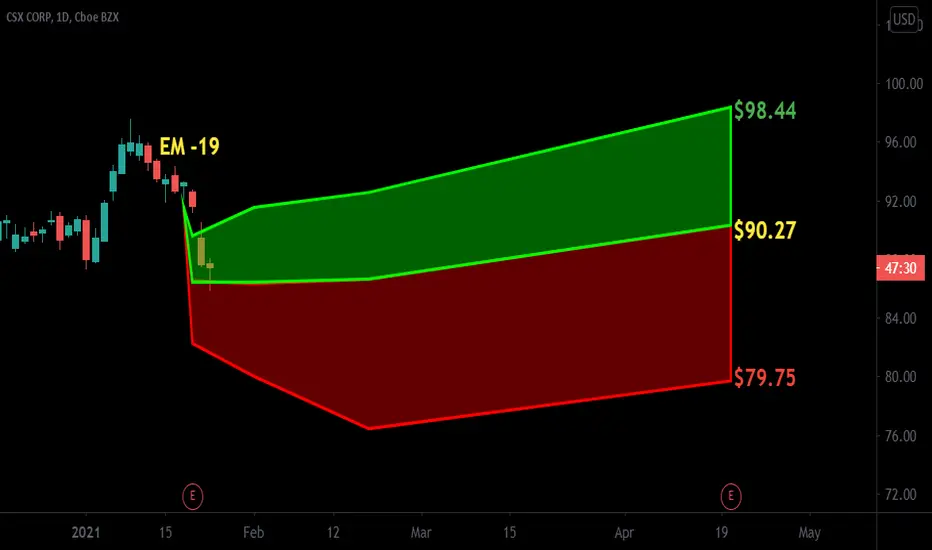
CSX Squat Reversal into EarningsSquat Reversal signals into PEMA trigger zone.
Heading into earnings with a Narrow pivot range and a higher developing pivot range.
On watch.

CSX Long over 86Volume is picking up with buyers > sellers.
Momentum shows we may be at a bottom and confirmed with Bullish hammer doji
RSI oversold levels

$CSX with a neutral outlook after its earning release The PEAD projected a neutral outlook for $CSX after a negative under reaction following its earning release placing the stock in Drift D
If you would like to see the Drift for another stock please message us. Also click on the Like Button if this was useful and follow us or join us.
CSX Bull flaggingNASDAQ:CSX long on breakout of the flag. JAN 15 $92.50 @ $1.20 SL upper trend line.
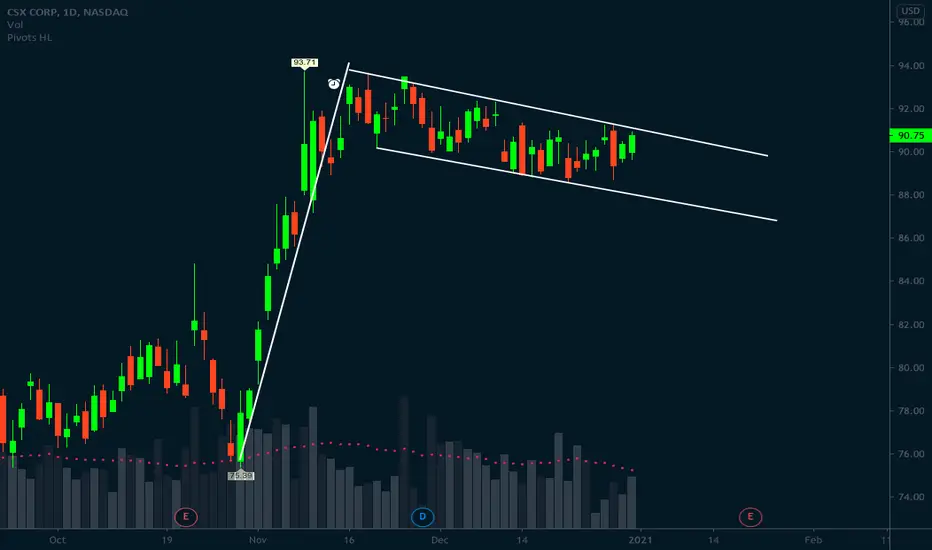

$CSX - $96.05 TargetI am long January 15 $90C's purchased on Thursday. Bullish consolidation in a bull flag after a major breakout to new ATHs. Target is $96.05. Earnings in two weeks.

$CSX - above $90.65 - looking for entryThis has been consolidating a long time, if it can get above the volume shelf and hold above $90.65, it would be worth an entry.

CSX Bull FlagLarge bullish volume, bull flag is curving upwards and technical indicators suggest a buy. Tradingview is rating CSX as a "buy"


AOS Bullish Bias!Due to strong building permits and housing starts data AOS could see more upside in price move. Looking for an entry above $93.00 level.


Cup and Handle Ascending TriangleLarge effective volume yesterday/meaning large players were buying this and there was also a pocket pivot
I have noticed that large players are not always super careful with entry..lol. Afterall, it is not always their money that they are spending.
Effective Volume analyses the intraday volume on the minute level to determine what small and large players are doing in terms of accumulation and distribution. For using the indicator you should basically understand: if the red line goes up, large players are buying on average, if it goes down, they are selling.
The idea here is that you only want to buy the stock when it actually starts to rise and when it arrives above the breakout level. It is very well possible that the stock never reaches this level. It is also possible that the stock only reaches this level next week. Both cases make sure you only enter the stock when the actual breakout happens. If it doesn't happen you have prevented a loss by never entering the stock. If you are a pull back trader or a bottom fisher, then these patterns may not be ideal for you. I love to bottom fish as well (o:
C&H patterns are only valid at long entry level.
There is also an ascending triangle and a rising wedge. CSX took a small dip down through lower trendline of RW. Rising wedges can be bearish.
Possible T2 116.75 to 125
Ascending triangles do fail, or bust like all other patterns do. The top trendline is R so it may not be easy to get through it
But if it does, it can become support (S)
To break an A triangle it must do so with confirmation and in an uptrend
Maybe just keep that in mind with this onecause the Ascending triangle is right there close to entry level.
It’s not about being right, but doing the right things when you are. Success isn’t in picking the stock but in how it is played once you own it. When to buy more and when to sell is far more important than knowing what to buy. One good trade can be a life changer.
Not a recommendation


$CSX - small bounce for $2 - $4NASDAQ:CSX - bounce off mid line of bullish parallel channel, seasonal play, good risk reward

CSX Getting ready to breakout$CSX
CSX Corporation
Keep a watch at 79.78 levels - About to break it.
Monthly Candle is turning positive as well.
More upside evident close to 111 in next few months.
#Diversify #SwingTrade
#DJT $DJT #trading #investing

CSX Long Play for Week of 7.12CSX looking bullish on the 4hr chart with the MACD crossover and the RSI looking up; along with ending the day on bullish volume.
Would like to enter the trade when we close hourly above 70 on bullish volume.
Target 1: 71.10
Target 2: 73.25
Target 3: 74.50
Stop: 67.50
Best of Luck,
--d0x

It's going down for real!We expect after after a good amount of sells , a very clean pull back. our rate is 60% the more we get closer to red support, the higher are rates.
