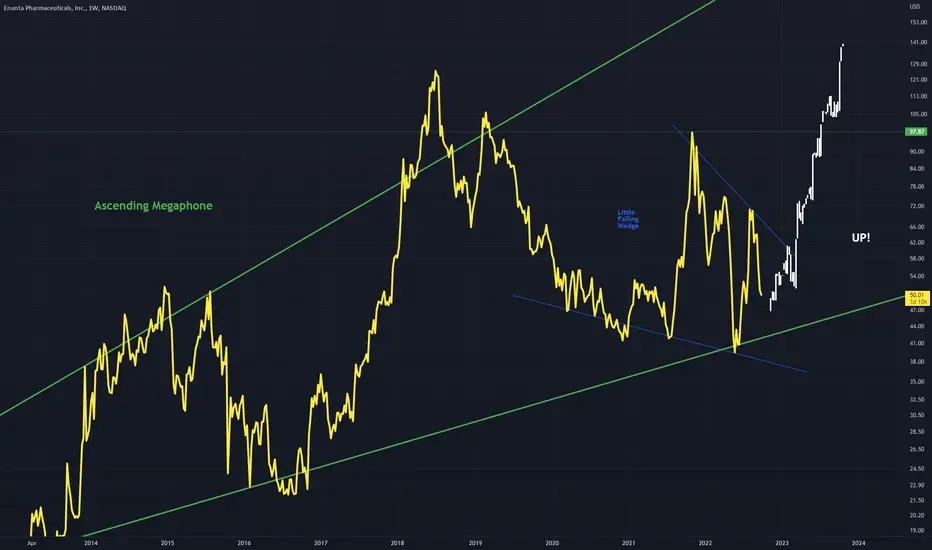
ENTA - Another Ascending MegaphoneAn Ascending Megaphone with a small falling wedge (A bullish pattern) contained within it
I expect price to break out bullishly to the upside out of this blue falling wedge structure
This breakout will continue the megaphone
Weekly timeframe
ENTA trade ideas
ENANTA LONG FROM THE 200 WEEKLY MOVING AVERAGEThe prices are dancing around the 200 weekly SMA and the level is a Fibonacci retracement of 0,618. I will try a long from this prices with an oscillation of 9-10% for the Stop Loss. If the count is correct we are assisting at the start of wave 5, this means to see the prices over the top of 3.

ValuEngine upgrades $ENTA to a STRONG BUY rating ValuEngine Forecast Models
1-Month 72.52 1.08%
3-Month 72.99 1.74%
6-Month 73.34 2.23%

ENTA: Long opportunityAn intraday high potential, Back Tested Long Analysis.
We ll try to enter into the correction of the downtrend movement.
DETAILS ON THE CHART
NOTE: Entry range area above the entry point, is calculated upon 80% of the recorded pullback back tested past performances
DISCLAIMER: This is a technical analysis study, not an advice or recommendation to invest money on.

