ENVX trade ideas
$ENVXGot strong support lower channel at 5.27
Forming higher lows in last 4 weeks
5.90 being ultra strong support since last three weeks (pre-earnings and post earnings).
Next support level is at 5.20.
If resistane at 7.1 is breached then technical targets would be 8.60, 9.80, 10.95 and 13.15

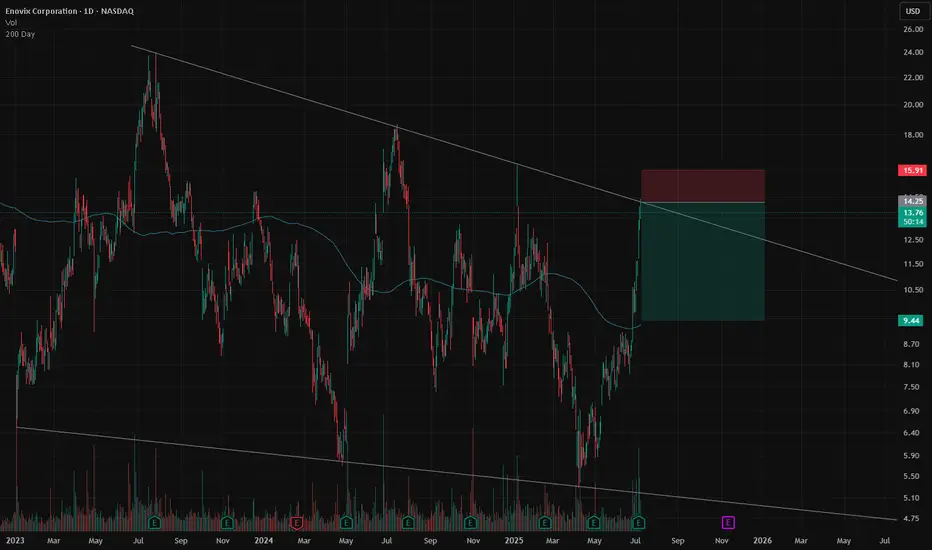
ENVX TradeENVX is the poster child of the 2021 SPAC/IPO bubble. It's shares have essentially been in a downtrend since going public.~35% short interest on the name, no need to go in depth on the fundamentals (or lack there of).
Technical play here, shares are grinding up on the long-term trend resistance line. Expecting a move back toward the 200 day SMA in the next couple months. Stop out at 16 if there's a squeeze, or things get memey.
Near term target - $9.50. Long term target - zero.
I like 5+ month expirations OTM puts here.
Good Luck! This is not financial advice
7/9/25 - $envx - Friends tell friends the truth7/9/25 :: VROCKSTAR :: NASDAQ:ENVX
Friends tell friends the truth
- not a fan of Raj, seems inauthentic on one front... and tbh, that might seem "judgy". i've made my money on wall street reading mgrs in the first 5 seconds i meet them. i'd just not give this guy my money, that's all. it's my human LLM.
- the company financials look ready to "explode" (mm in a good way) if you ask wall street/ expectations. but i don't trust that either. i always do my own work.
- all battery (*cough* meme) tech has done well since april lows
- important to choose names that have solid balance sheets, growth ... and ideally leaders in both respects. i keep coming back to NYSE:SES given it's size, similar if not better growth vs. much larger comps. more chemistry-agnostic software/tech
- so am i actually shorting ENVX. no. but i find too many ppl these days will put a "buy" on things that are buys and "holds" (whatever that means) and actual sells get a "ehh... keep it..". NO. if it's not working OR you have better alternatives dump that trash.
Listen. class in session here for a moment.
One of the most important things you can do in trading, poker and life (all are very similar - also different - but similar)... is when you have a bad hand, you get introduced to a sus person... you find yourself in an unfavorable decision AND you can decide to either engage or just say "thanks but no thanks"... say "thank you very much and no thank you". Don't say "thank you and i'll follow up" or "thank you and i'll consider it". forget that waste of your time. "thank you" (be polite) and "no thank you" all in the same sentence. if you've got some history/ legacy/ other ties.. more complicated. But of course, when we look at stonks, we can have that decision. If we lose a bit of coin. what. f'n ever. nobody EVER shoots 100%. or 80% or even 70%. move on. take your losses. move on. if a stock is non-obvious. move on. maybe you come back to it. should be for a good reason beyond FOMO. but re-consider. alas. you have the decision to say no.
we talk about time being scarce. so is your ability to give two shoes about some of these stocks. if you're not high conviction, then forget it. time is too short to diversify and make excuses.
make time for those who matter
make space in your PnL for the stocks that will drive results
and forget the rest.
Gn my friends
V

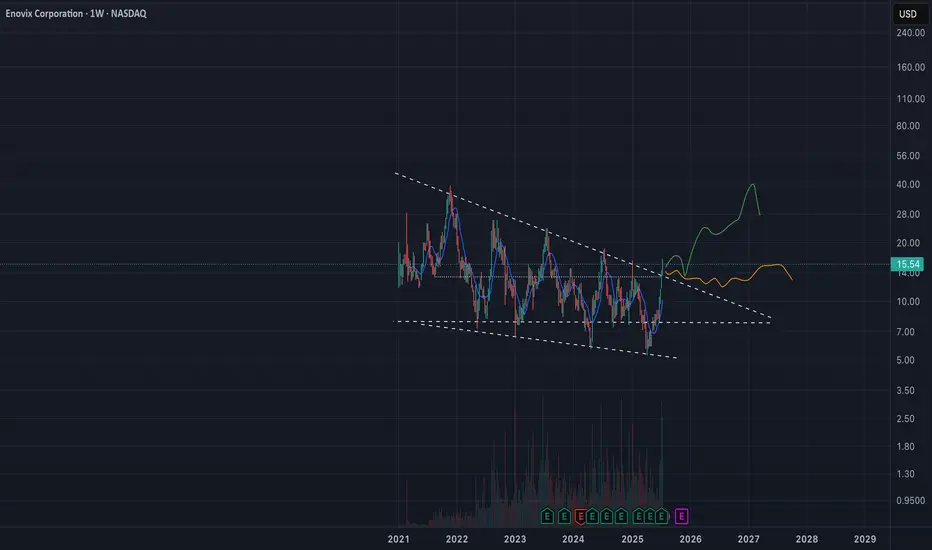
Envx long possible 100% returnsI’m seeing a great opportunity with rejection. Falling wedge in the making with a potential of 100% gains. Close half and let the other half ride it out. Free shares.

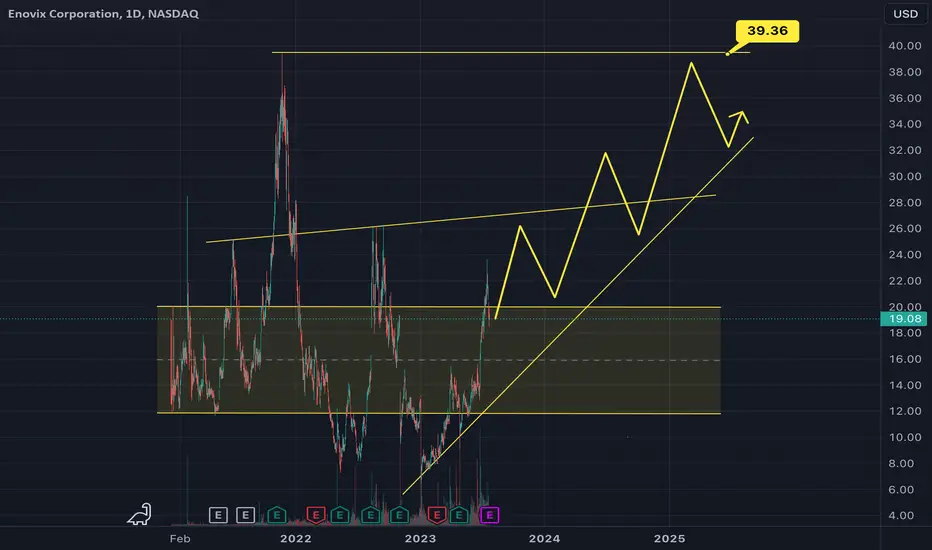
ENVX $40. incoming?Enviox targets: $42.10 double bottom, $46.90 triple bottom, $47.60 falling wedge targets all possible.

ENVX Enovix: An optimistic battery investment for the futurewww.forbes.com
I am too tired to write now but I bought this stock as an investment. Great team behind it and further ahead than other new-age battery stocks in my onpinion

Technical Analysis of Enovix Corporation (ENVX)### Technical Analysis of Enovix Corporation (ENVX)
#### Overview
The chart shows the daily price movement of Enovix Corporation (ENVX) on the NASDAQ exchange. It features Fibonacci retracement levels, trend lines, and projected price paths indicating potential future movements.
#### Fibonacci Retracement Levels
The Fibonacci retracement levels are drawn from the swing low around early 2022 to the swing high later in the same year. The key levels identified are:
- **0.236 (11.15 USD)**
- **0.382 (13.99 USD)**
- **0.5 (15.55 USD)**
- **0.618 (17.57 USD)**
- **0.786 (20.39 USD)**
These levels can act as potential support and resistance zones.
#### Current Price Action
The current price is around **16.52 USD**, situated between the 0.5 Fibonacci retracement level (15.55 USD) and the 0.618 level (17.57 USD). The recent price action shows that the stock has rebounded from the 0.382 level (13.99 USD) and is testing the higher Fibonacci levels.
#### Trend Lines
The chart features a descending trend line from the highs in 2021, intersecting with the Fibonacci levels. There is also a shorter-term descending trend line providing additional context for potential resistance.
#### Resistance Levels
- **17.57 USD (0.618 Fibonacci level)**
- **20.39 USD (0.786 Fibonacci level)**
- **23.99 USD (swing high)**
These levels are important to watch as potential resistance if the price continues to move upward.
#### Support Levels
- **15.55 USD (0.5 Fibonacci level)**
- **13.99 USD (0.382 Fibonacci level)**
- **11.15 USD (0.236 Fibonacci level)**
These levels serve as crucial support zones in case of a price pullback.
#### Projection
The chart indicates a potential upward movement, with price projections suggesting a possible path towards 34.38 USD (1.618 Fibonacci extension level) by 2025. The projected path involves a series of higher highs and higher lows, indicating a bullish trend if these projections hold true.
### Conclusion
Enovix Corporation (ENVX) is showing signs of a potential bullish reversal, with key support at 15.55 USD and resistance around 17.57 USD. Traders should monitor these levels for breakout or breakdown scenarios, considering the broader market trends and any significant news impacting the stock.
### Disclaimer
This analysis is just an opinion and should not be considered as financial advice. Trading stocks involves risk, and you should do your own research or consult a financial advisor before making any investment decisions. Any profit or loss is the responsibility of the audience, and I do not take any responsibility in this regard.

ENVX Strategy for next weekWe can see that price has surged due to positive news. headed towards a weekly sell side fair value gap, with a buy side faire value gap just on the extrimity of the red rectangle.
So we swept all the stop buy orders and now potentially heading for the down side.
We have also a weekly/daily order block that will serve as support.
If you see the chart, on May 2nd we had good news, the price gapped up and came back to a daily order block before moving forward.
How to trade :
if price goes again into the red area on the daily tameframe, and closes again below it. we can short this, with a TP at the OB dashed line. if not, we can wait for the price to fall back to the OB dashed line, and bounce off of it before going long.

Looking for $20-$30+I believe this company will actually deliver what they are promising and this will be a lucrative investment to get in on early! I'm long.

ENVX 200d support breakoutAttempting to buy breakout of 200d. Tight stop loss will consider selling the trend line or riding momentum to 12.50. MA crossover 7 and 14d alert for sell target.

ENVX gathering energy for a move to $20 by JulyNASDAQ:ENVX
Narrowing since December 21. Pops every 8-9 months or so. Lot's of demand under $10. 20 strike calls coming in of late.
www.tradingview.com

ENVX.... Looking bullish This is my next trade im looking to get into. Price has tested this level and everytime we get a nice action. On the higher time frames you can see the nice retest of the order block and a possible "W" formation for the win. MACD signaling buy and RSI coming out of the dirt is giving nice confluence I have a 30$ price target
Please boost if you support this idea and feel free to comment like and follow


failed to make higher highs -> how about higher lows?09/20 - NASDAQ:ENVX announced the acquisition of privately-held Routejade, an established Korean battery manufacturer for a total consideration of approximately 6.2 million shares of Enovix common stock and $16.5 million in cash assuming purchase of 100% of Routejade. The acquisition provides Enovix with vertical integration of electrode coating and battery pack manufacturing while adding an established lithium-ion battery business with factories in Korea, along with complementary products, customers, and suppliers. The transaction is expected to close in the fourth quarter of 2023 and be immediately accretive.

#ENVX Straddle /Trade PlanAccording to our observations a very large neutral position with exp date September, 15.
Based on our team's research of the options market, we expect buy activity at the support level or sell activity at the resistance.
We primarily consider levels to be activity zones, but not to be a super-fine level for establishing a limit order. Use them in combination with our own strategy, not in alone.
We do the best research as we can to find new opportunities in the massive amount of information every day to help you make data-driven trading decision.
Please feel free to leave any comments you have and like this idea if you agree with us. Any feedback or comments will be read. We appreciate it all!

Judgment day... Longs or Shorts?Earnings today (26.07), so this is a risky trade.
Ennovix has a large short interest (~25%) and is very volatile (weekly volatility is 6%). Stock is
If this goes under $18.50 then get out.
There is a small gap at $20.40, so this can be the 1st PT for 1:1 RR.
A little longer PT is $26.
Divergence on:
SMI
Willimas %R
RSI flat
MACD not perfect.

ENVX Enovix Corporation Options Ahead of EarningsAnalyzing the options chain and the chart patterns of ENVX Enovix Corporation prior to the earnings report this week,
I would consider purchasing the 20usd strike price Calls with
an expiration date of 2023-9-15,
for a premium of approximately $2.55.
If these options prove to be profitable prior to the earnings release, I would sell at least half of them.
Looking forward to read your opinion about it.

$ENVX I'm from the futureHey everyone just stopping by from the future to let you know that things are going well with Enovix ;)
A price target of $50 is easy ... I'm betting for $500 long-termRecent demand overwhelming supply = Strong hands accumulation ... Now morphing into an IH&S base with measured target $50 on trigger ...
Analyst forcasts via TipRanks: Based on 8 Wall Street analysts offering 12 month price targets for Enovix in the last 3 months. The average price target is $41.00 with a high forecast of $100.00 and a low forecast of $18.00. The average price target represents a 118.09% change from the last price of $18.80.

ENVX - ARMY Contract Maybe Undervalued* Meant to put this on the ENOVIX thread*
A Couple things to note is Enovix has been on a steady rise and has had bullish catalyst released. It's on the hook to hit the next leg. Lame pun for the Hook showing on the chart pattern
" Enovix said the agreement moves the program toward full volume production. The cells will be used to build pre-production CWB packs.
The advanced silicon battery company said the deal is for it to produce commercial cells for use within U.S. Army soldier's central power source, called the Conformal Wearable Battery.
" - MarketBeat
This launched the stock price to $19 ON JULY 6TH.
SPY being on an extreme bull run and new 52 week high ENVX following a similar pattern.
ENVX, RSI on close to oversold, Williams showing the stock is curling. ENVX is currently aligned with SPY and have the same exact pattern It may run up with SPY so long as it remains bullish.
I Expect it to touch at least $25 but theres a lot of turbulence up there as thats where it's been consolidating in the past. General consensus PT is $38.
ENVX has an average rating of buy and price targets ranging from $15 to $100, according to analysts polled by Capital IQ.
Trade Responsible,
#TradeTheWave

$ENVX What do you think?Enovix has been on a tear lately on the Army PO announcement and it's broken through multiple resistance points. When will it stop going up? Stay tuned to find out. PS I am not a trader, I just look at charts for fun.

Momentum will move ENVX back to its ATH before ChristmasThe recent spike in ENVX stock followed a purchase order from the U.S. Army.
The latest purchase order is a positive step for Enovix as the company moves its U.S. Army program closer to full-volume production. The company is setting up the infrastructure for high-volume manufacturing and scaling its production. The company expects to produce 180,000 cells in 2023 from its Fab-1 facility. Further, the company recently announced that it has already achieved its Q2 production forecast of 18,000 units.
Further, on the commercialization front, Enovix is progressing well with continued design wins. While the company is ready to scale, the broad applications of its battery technology continue to expand its TAM (total addressable market), offering significant growth opportunities ahead.
ENVX’s battery technology has wide applications in consumer electronics, including wearables, mobile phones, and computing. Moreover, opportunities in new categories, including augmented reality, medical devices, and the lucrative EV (Electric Vehicle) market.
According to TipRanks, ENVX stock has received seven unanimous Buy recommendations from top Wall Street analysts. Meanwhile, these analysts’ average price target of $45.67 implies 177.97% upside potential.
