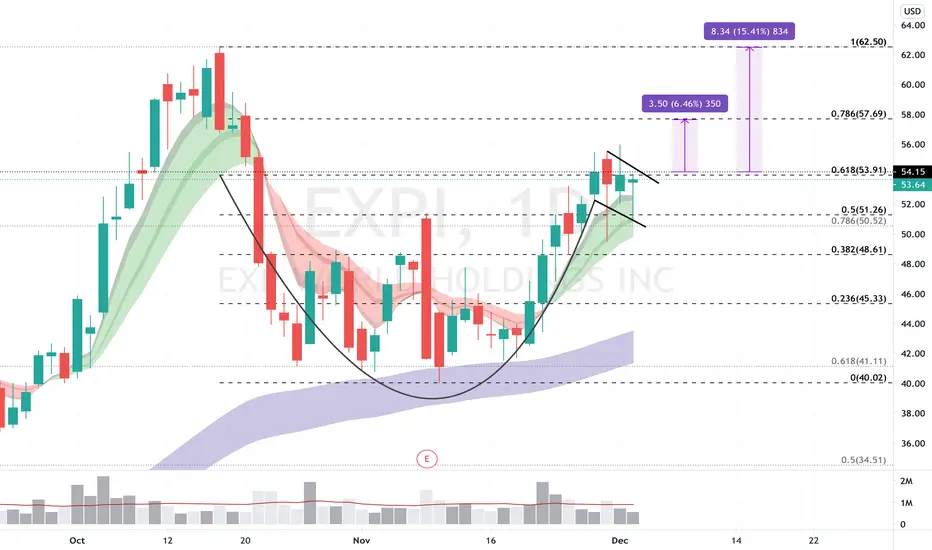
EXPI over 54.15Cup and handle forming, handle a nice basing of the previous move, can push towards ATH.
EXPI trade ideas

NASDAQ: EXPI / eXp World Holdings IncHi.
Look at this beauty.
If you want new shares, like wildly and follow wildly.
It is my personal opinion.
It isn't investment advice.


EXp World Holdings This is my take on what I see, technically.
Confluence (3 or more):
1. H.T.F. continuation order block formed. Bull's favor.
2. P.A. heading towards order block after B.M.S.
3. P.A. breached previous LHs. Precursor.
4. Bullish Wedge currently forming from H.T.F. perspective.
5. P.A. rallied after O.B's 1st test.
I would look for price to break lower before a B.A.R. occur with the diagonal resistance. If the bears were to breakthrough barriers then I would wait for a B.A.R. of the $32.50 down to the $19.72 level since there's a nice potential profit margin within that range that can be seen from a bird's eye view. We shall see...
Fundamentals:
"EXp World posted revenues of $564.02 million for the quarter ended September 2020, surpassing the Zacks Consensus Estimate by 37.73%." -Yahoo Finance

LONG EXPIbe careful buying options. Don't purchase a short dated option if you don't have a fundamental understanding of the anticipated market makers move before buying an option before earnings.


$EXPI can rise in the next daysContextual immersion trading strategy idea.
Exp World Holdings, Inc. provides cloud-based real estate brokerage services for residential homeowners and homebuyers in the United States, Canada, the United Kingdom, and Australia.
The demand for shares of the company looks higher than the supply.
This and other conditions can cause a rise in the share price in the next days.
So I opened a long position from $50,68;
stop-loss — $44,29.
Information about take-profits will be later.
Do not view this idea as a recommendation for trading or investing. It is published only to introduce my own vision.
Always do your own analysis before making deals. When you use any materials, do not rely on blind trust.
You should remember that isolated deals do not give systematic profit, so trade/invest using a developed strategy.
If you like my content, you can subscribe to the news and receive my fresh ideas.
Thanks for being with me!


$EXPI High Tight Flag Breakout$EXPI is breaking out of a high tight flag along with MACD and stochastic bullishly crossing up
Keep in mind I am not a financial advisor and this information is strictly for educational purposes only.

Worth watching as the housing market heats upA cloud real-estate brokerage to keep an eye on as the housing market heats up. Probably a better mid to long-term hold than momentum stock.

EXPI bullishStrong earnings gap
Pull back to test 20 ma
Classic hammer candle
Looks to go up
Can go to 45-50

EXPI:NASDAQ - EXP WORLD HOLDINGS - Up 450%EXPI is a cloud-based real estate brokerage firm and has had a great run up. I've held it for a little while and doing well out of it, but suspect it needs a pullback at some stage to be able to hold onto some of these gains. Worth a watch.

eXp World Hldngs $EXPI "SKY"$EXPI most likely will not stop till touch the pivot resistance
12 months Consensus Price Target: $17
if you find my charts useful, please leave me "like" or "comment".
Please don't trade according to the ideas, rely on your own knowledge.
Thx

2 Long Scenarios for EXPIWeekly Chart :
After 2.5 Years of Solid and Technical Bullish trend NASDAQ:EXPI got into Consolidation in form of Rectangle Pattern.
Note the free range between each Top and the Bottom which follow that top - Strong Momentum.
Note the Clear defined Recatngle Boundaries.
Note the attempts to Attack The Resistance level of the Rectangle, Compare to the Attemps to hit The Support level - 5 Points for the Buyers, 2 Points for the Sellers.
Note the Mid bottom which failed to reach the Support - Weaknes of Sellers.
In Technical Anaylsis Theory, Rectangle Formation have a probability of 75% to continue the previous trend.
The Trading Plan:
Trade 1 - LONG : 11.8 To 19.5:
Wait for a Clear Minor Long Signal on 11.8 Level
1. Strong Daily Buying Candle.
2. Retest of 11.8 and buying Candle confirmation.
3. New Bottom Bellow 11.8 and then strong penetration of 11.8.
Trade 2 - LONG :6.66 To 19.5
If the rectangle Pattern will stay active, and the price will go to check the support level (6.66),
We will Initiate the trade from there - Less Likly to happen.
If so, The same Signal term applied on 6.66 Level.

Could EXPI be going further upEXPI is already trading close to 3 months high and has announced yesterday that they will be having an investor conference on 19/06/2020
It has quite recenty had a huge bull flag and now currently having a sort of consolidation period within the channel.
I'd say that the stock is getting prepared to go higher highs soon within the next 3 working days.
what do you guys think ?

Could EXPI be going further upEXPI is already trading close to 3 months high and has announced yesterday that they will be having an investor conference on 19/06/2020
It has quite recently had a huge bull flag and now currently having a sort of consolidation period within the channel.
I'd say that the stock is getting prepared to go higher highs soon within the next 3 working days.
what do you guys think ?

$EXPI can rise in the next daysContextual immersion trading strategy idea.
eXp World Holdings, Inc. provides cloud-based real estate brokerage services for residential homeowners and homebuyers in the United States, Canada, the United Kingdom, and Australia.
The demand for shares of the company looks higher than the supply.
These and other conditions can cause a rise in the share price in the next days.
So I opened a long position from $10,23;
stop-loss — $9,32.
Information about take-profits will be later.
Do not view this idea as a recommendation for trading or investing. It is published only to introduce my own vision.
Always do your own analysis before making deals. When you use any materials, do not rely on blind trust.
You should remember that isolated deals do not give systematic profit, so trade/invest using a developed strategy.
If you like my content, you can subscribe to the news and receive my fresh ideas.
Thanks for being with me!

Read the rules please. Rules:
Believe that anything can happen - so stay neutral.
Always define your stop loss. Trade with your own risk.
We trade only when price action shows a "reversal pattern" within our predefined zones = "Trend + Zone + Reversal".
This reversal pattern typically will be seen on a minute chart.
Be patient.
Good luck.
(Will "try" to update if we get in this trade).

EXPI for a SpecI'll be the first to say I didn't know much about this company... but a glance at the fundamental numbers left me quite impressed.
As such, I'd like to get involved with this one, but it's up nearly 400% in the past year, so I'm in no hurry to buy.
Ideally, I'd like to see a pullback to the 61.8% retracement around $9 before piling in. Conversely, if shares continue to climb, I'd rather buy the pullback after the breakout. Also worth noting is the white dashed line of support at $10.00.
So in short, keep this on your radar, but don't rush in. Let the price come to you, or if that fails, wait until the momentum accelerates enough to breakout to new highs, them jump in.
